
OpenStreetMap: A Year of Edits 2012
Just like last year I've analysed all the edits to OpenStreetMap and produced a visualisation. It was a bit trickier this year as I also wanted to visualize the work of the redaction bot as well as the "redaction period" and the switch to ODbL for OpenStreetMap data.
The result is: OpenStreetMap: A Year of Edits (2012):
This animation shows all additions and modifications of nodes (flashes) and cumulative edits (fading to purple) in 2012. Additional visualisations are the redaction bot's work (flying away yellow spheres) and the shift to ODbL (green flash). It gives a good overview of the effort that 1000s of contributors put in to make OpenStreetMap the best source of mapping data.
You can see the video in HD on Vimeo.
I have started to make the code for this available through GitHub, but the code is very much not modularized and it is likely it will only work on my set-up. Expect this to change for next year!
Mappy New Year!


Life Line
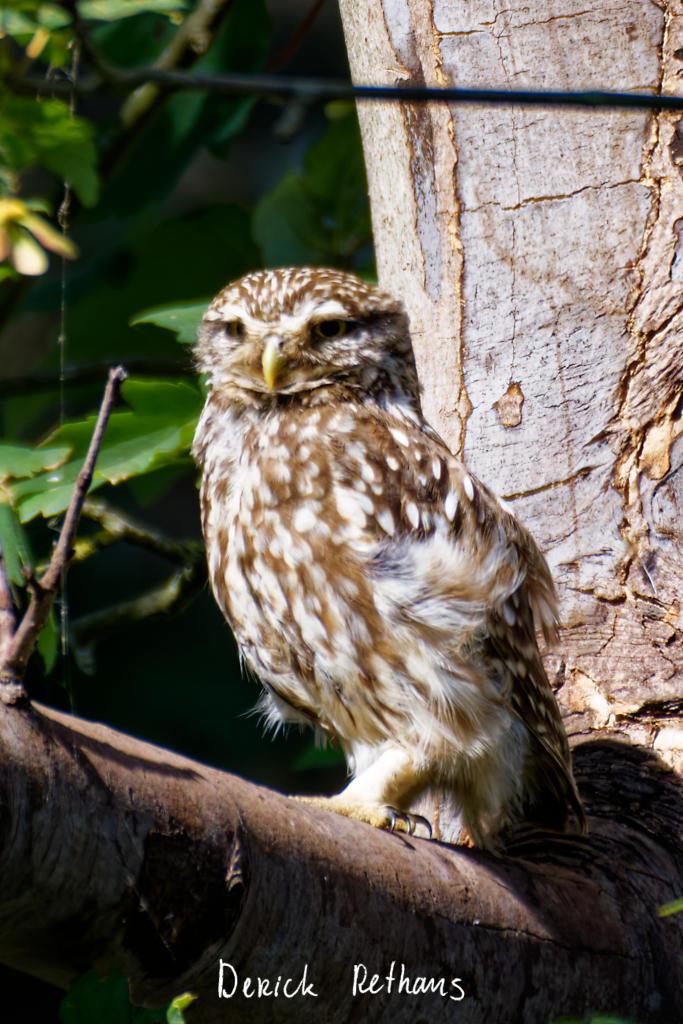
Little Owl owlet
This lovely owlet was quite easy to find in a London Park, with some help as they camouflage so well!
I saw its sibling too.
#BirdPhotography #BirdsOfFediverse #Photography #Nature #London #BirdsOfMastodon
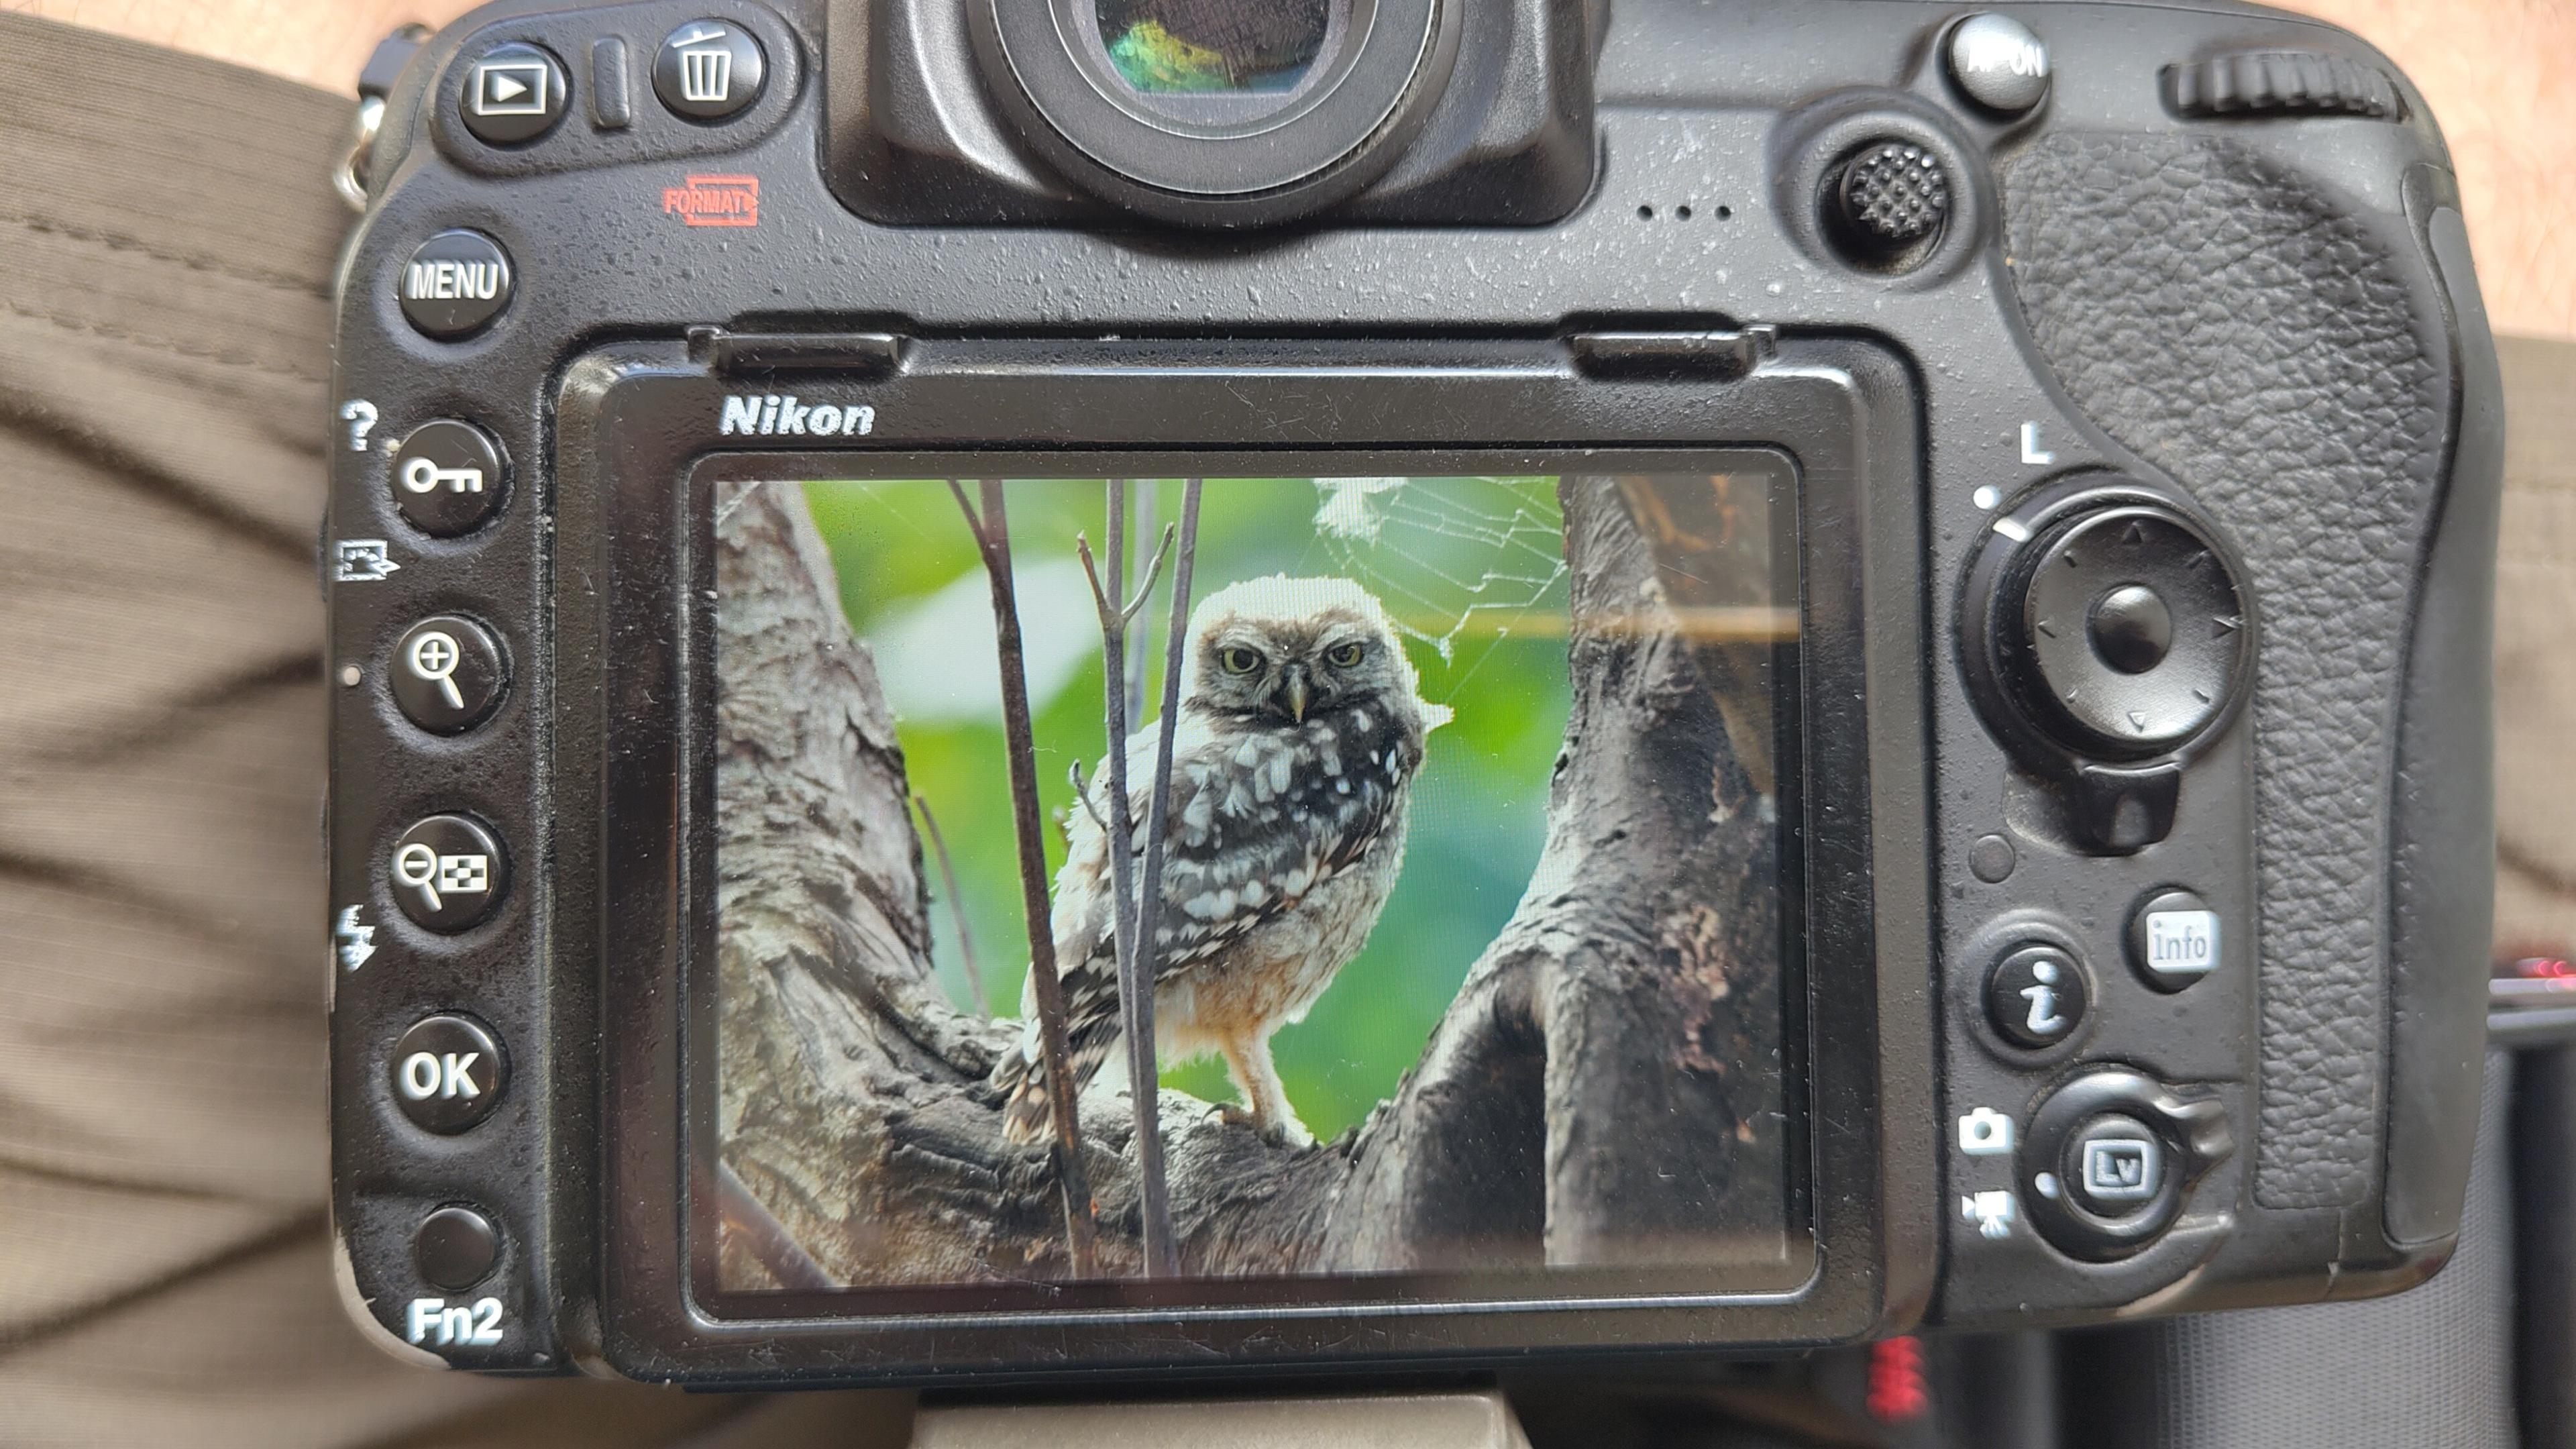
I went to a park (Bushy Park) to look for some owls.
I found Owls (Little and Tawny), but also a Green Woodpecker and two Kingfishers.
Snaps from my camera screen, and real photos will follow, but not of the Kingfishers as they were too far away and the photos are blurry.
#london #BirdPhotogaphy #BirdsOfMastodon #Birds #photography #BirdsOfFediverse #BushyPark
I hiked 13.8km in 4h44m12s
Created a chocolate shop and a restaurant; Updated 6 restaurants and an address; Confirmed 5 restaurants, a community_centre, and 3 other objects
Created a restaurant, a fast_food, and 2 other objects; Deleted a restaurant
I walked 8.5km in 1h31m45s
Created 2 buildings and a hairdresser shop; Updated a restaurant and an estate_agent office; Confirmed a cafe
I walked 2.2km in 38m09s
Merged pull request #1096
Bump actions/checkout from 6 to 7
Merged pull request #1095
Improve Tiverton Green mapping
Created 2 gates
I walked 7.1km in 1h23m15s
I walked 1.0km in 9m24s
Realign streets. They now have much less wide corners into each other.
Updated a fast_food
I walked 9.1km in 1h35m41s
I hiked 4.7km in 3h24m10s
I walked 6.7km in 1h12m03s
I walked 7.7km in 1h47m24s
Updated a pub
Updated a pub
Created a bar; Updated a bar; Confirmed a restaurant and a bar
Shortlink
This article has a short URL available: https://drck.me/osmyoe12-a1g