
Xdebug 2.3: Profiler File Compression
This is the seventh (and last) article in a series about new features in Xdebug 2.3, which was first released on February 22nd.
When you make profiling dumps with Xdebug, the file size can grow quite large. Even with a simple Drupal page a profile file is easily close to 1Mb.
For each function call, the file contains the location and name of the calling function, and then a list of functions that have been called. For example, the following snippet shows that the _cache_get_object function in /home/httpd/drupal-test/drupal-7.15/includes/cache.inc calls variable_get in /home/httpd/drupal-test/drupal-7.15/includes/bootstrap.inc twice, and DrupalDatabaseCache->__construct once:
fl=/home/httpd/drupal-test/drupal-7.15/includes/cache.inc
fn=_cache_get_object
22 68
cfl=/home/httpd/drupal-test/drupal-7.15/includes/bootstrap.inc
cfn=variable_get
calls=1 0 0
27 4
cfl=/home/httpd/drupal-test/drupal-7.15/includes/bootstrap.inc
cfn=variable_get
calls=1 0 0
29 2
cfl=/home/httpd/drupal-test/drupal-7.15/includes/cache.inc
cfn=DrupalDatabaseCache->__construct
calls=1 0 0
31 5
In those 15 lines, you can already spot a lot of duplicated information. The Callgrind Profile Format which Xdebug uses for writing profiling information allows for Name Compression. This allows a write, such as Xdebug, to simple refer to longer strings by a number. This number is assigned the first time a certain file name or function name is encountered. The above snippet, from the same request of a Drupal site, with Name Compression enabled now looks like:
fl=(4)
fn=(53) _cache_get_object
22 80
cfl=(2)
cfn=(45)
calls=1 0 0
27 4
cfl=(2)
cfn=(45)
calls=1 0 0
29 3
cfl=(4)
cfn=(52)
calls=1 0 0
31 5
Every file name and function name, except for _cache_get_object has been previously defined, and hence, is not repeated in its entirety, but just by its identifier. This sort of compression makes the profiling files a lot smaller. In this case, my simple-Drupal-profiling file went down from 926Kb to 385Kb.
Other parts in this series:


Life Line
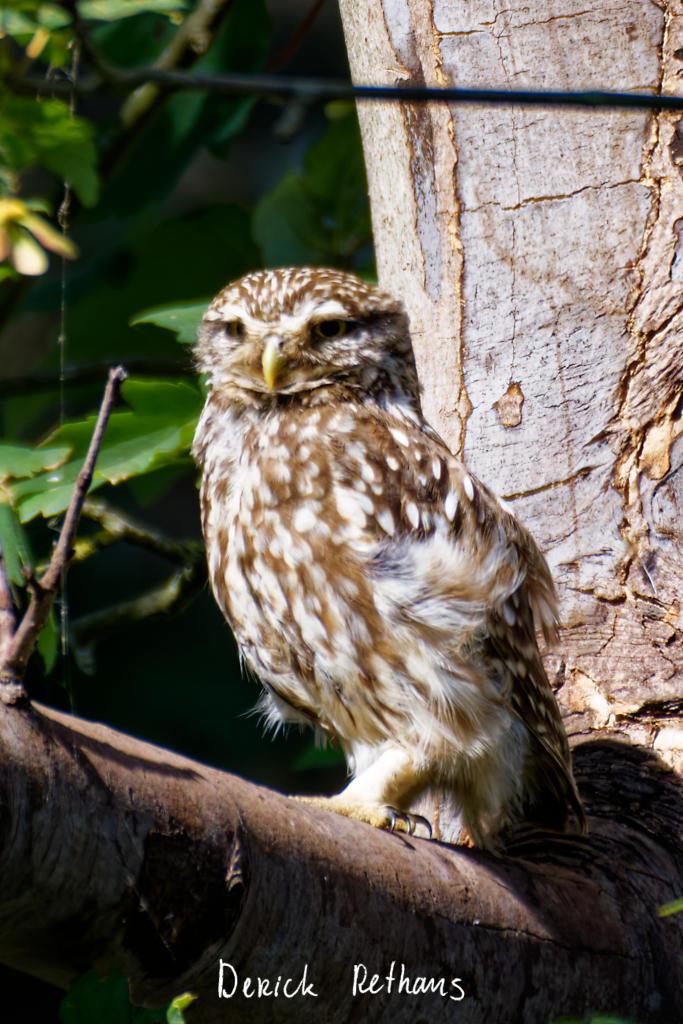
Little Owl owlet
This lovely owlet was quite easy to find in a London Park, with some help as they camouflage so well!
I saw its sibling too.
#BirdPhotography #BirdsOfFediverse #Photography #Nature #London #BirdsOfMastodon
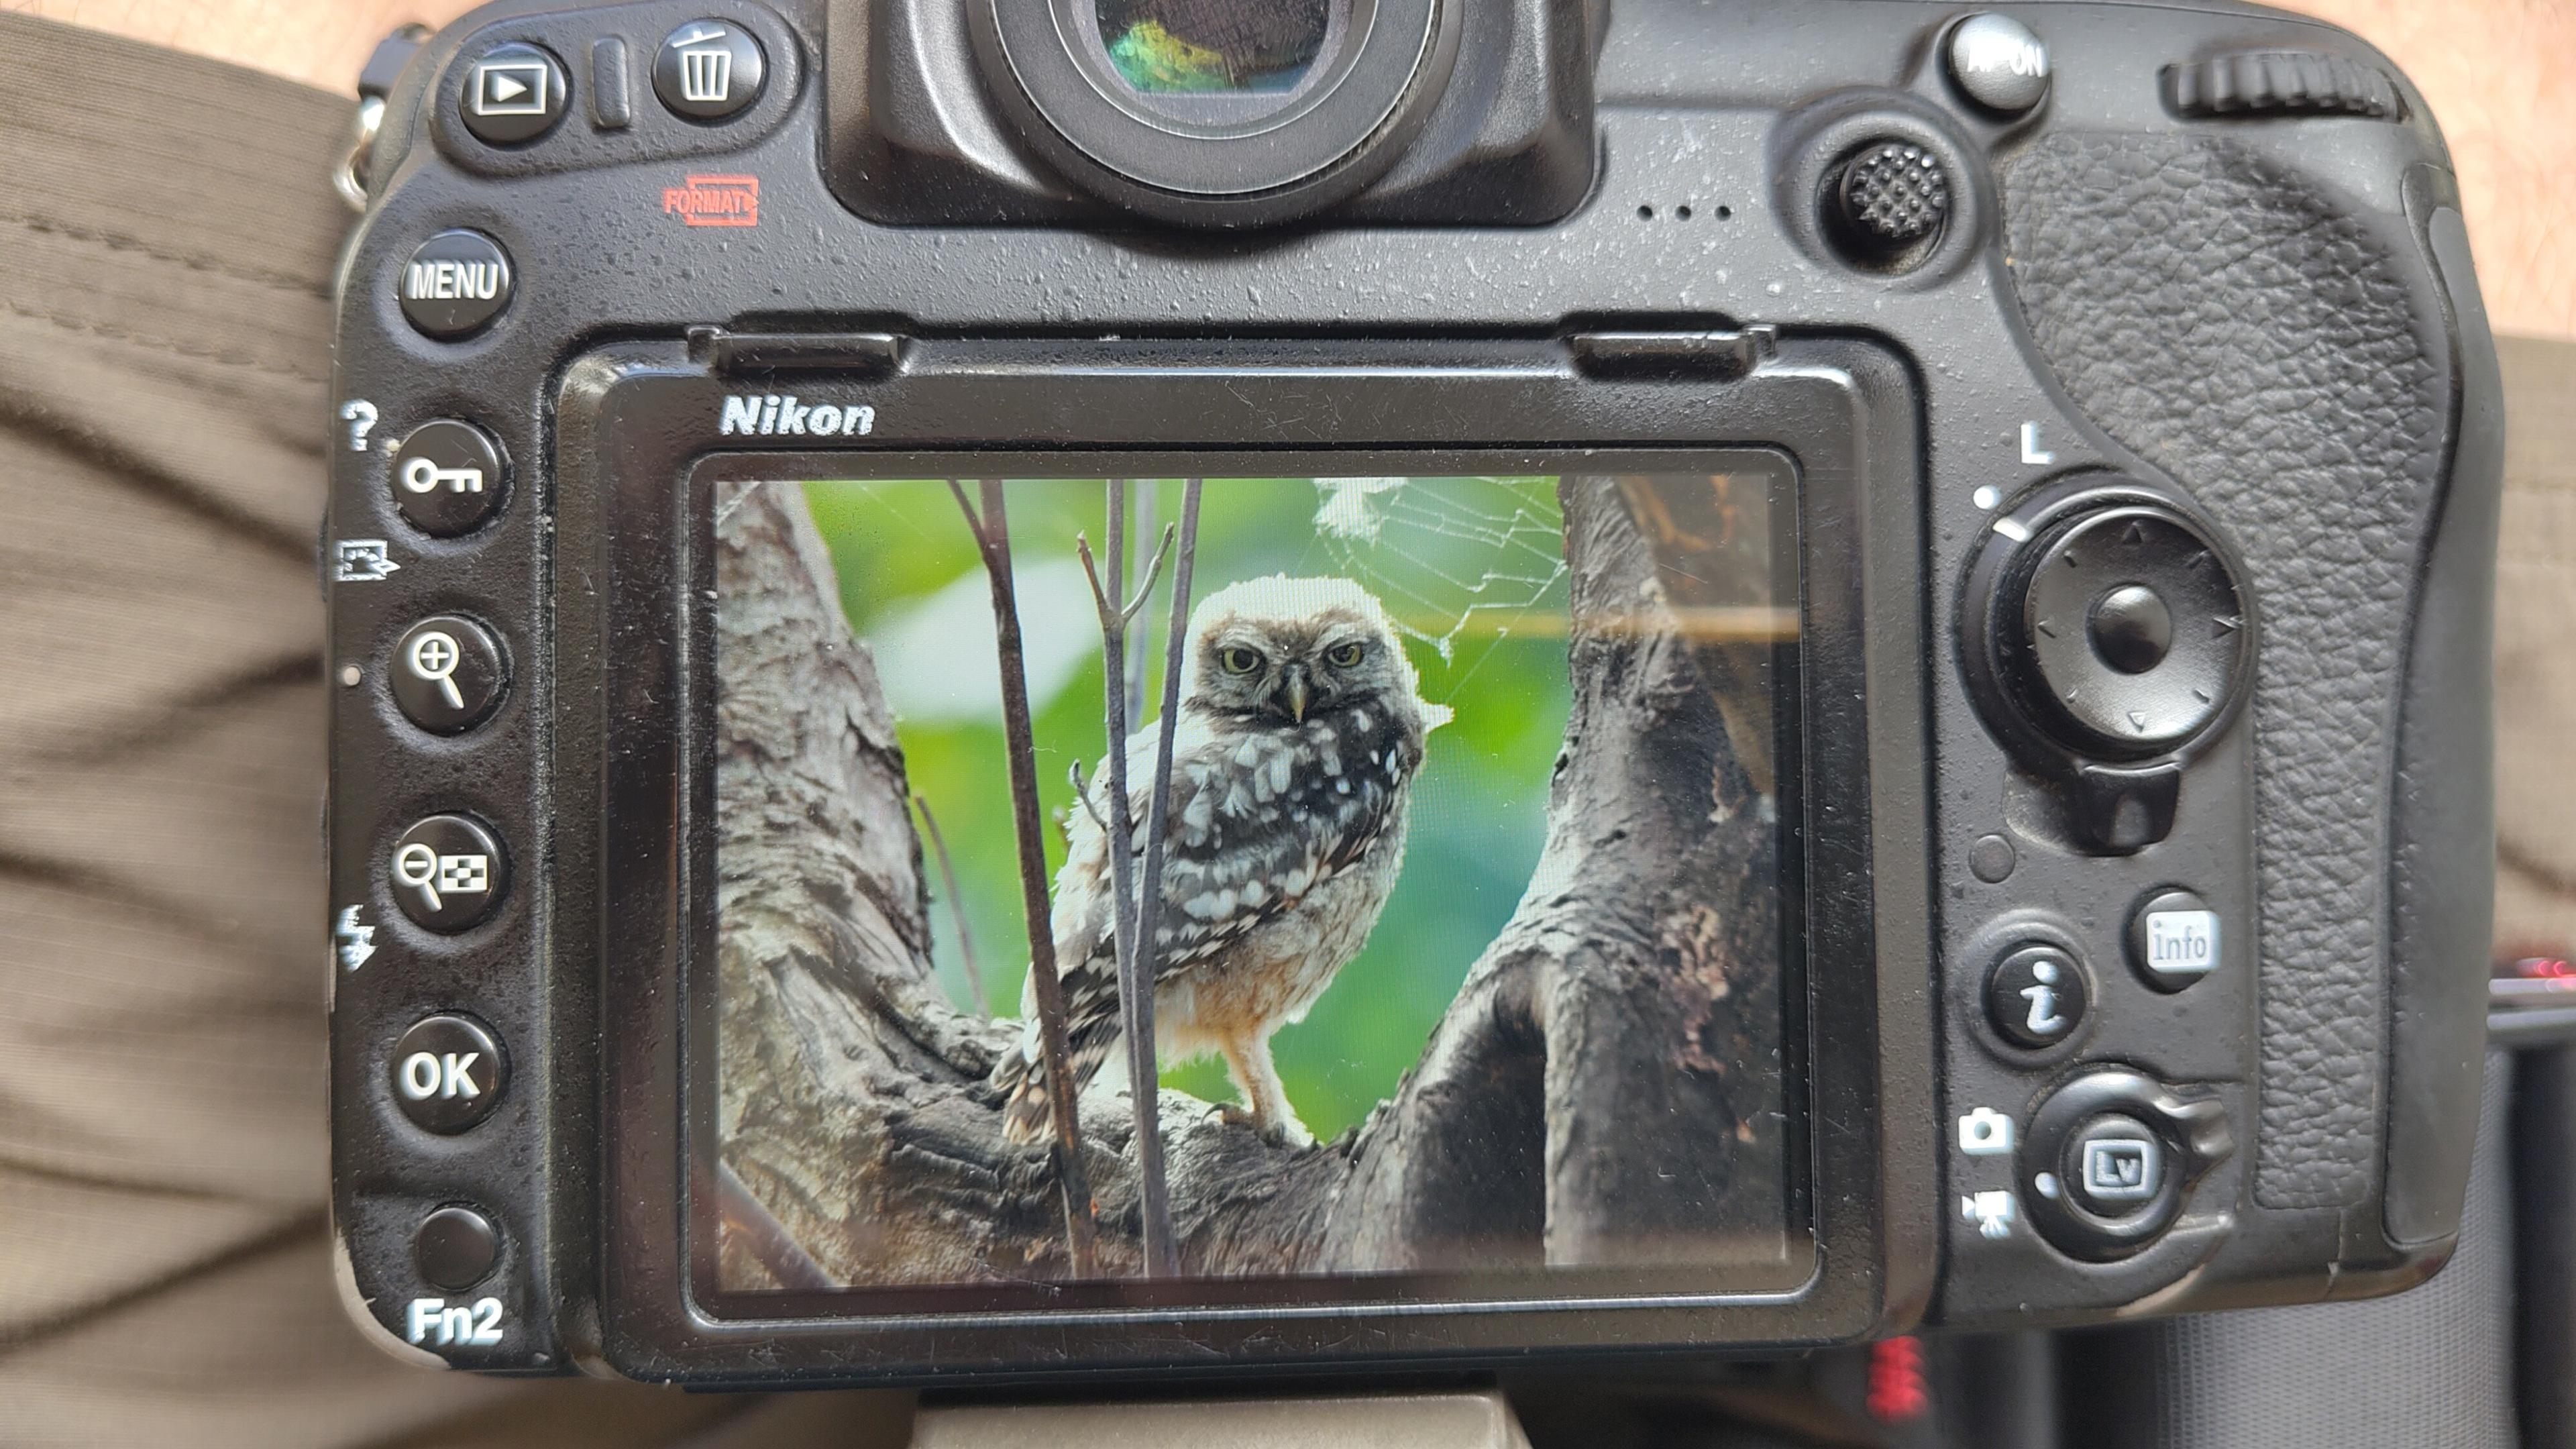
I went to a park (Bushy Park) to look for some owls.
I found Owls (Little and Tawny), but also a Green Woodpecker and two Kingfishers.
Snaps from my camera screen, and real photos will follow, but not of the Kingfishers as they were too far away and the photos are blurry.
#london #BirdPhotogaphy #BirdsOfMastodon #Birds #photography #BirdsOfFediverse #BushyPark
I hiked 13.8km in 4h44m12s
Created a chocolate shop and a restaurant; Updated 6 restaurants and an address; Confirmed 5 restaurants, a community_centre, and 3 other objects
Created a restaurant, a fast_food, and 2 other objects; Deleted a restaurant
I walked 8.5km in 1h31m45s
Created 2 buildings and a hairdresser shop; Updated a restaurant and an estate_agent office; Confirmed a cafe
I walked 2.2km in 38m09s
Merged pull request #1096
Bump actions/checkout from 6 to 7
Merged pull request #1095
Improve Tiverton Green mapping
Created 2 gates
I walked 7.1km in 1h23m15s
I walked 1.0km in 9m24s
Realign streets. They now have much less wide corners into each other.
Updated a fast_food
I walked 9.1km in 1h35m41s
I hiked 4.7km in 3h24m10s
I walked 6.7km in 1h12m03s
I walked 7.7km in 1h47m24s
Updated a pub
Updated a pub
Created a bar; Updated a bar; Confirmed a restaurant and a bar

Shortlink
This article has a short URL available: https://drck.me/profilecomp23-bp6