
Xdebug Update: October 2023
In this monthly update I explain what happened with Xdebug development in the past month. These are normally published on the first Tuesday on or after the 5th of each month.
Patreon and GitHub supporters will get it earlier, around the first of each month.
You can become a patron or support me through GitHub Sponsors. I am currently 35% towards my $2,500 per month goal, which is set to allow continued maintenance of Xdebug.
If you are leading a team or company, then it is also possible to support Xdebug through a subscription.
In the last month, I spend around 32 hours on Xdebug, with 25 hours funded.
Towards Xdebug 3.3
In last month's update I explained that I was investigating whether Xdebug can make use of PHP's Observer API. It turns out that it can be used to intercept function calls, but only include or require calls if the included files contain code, and not just class definitions. As Xdebug treats include and friends as actual function calls, I can unfortunately not solely rely on the Observer API.
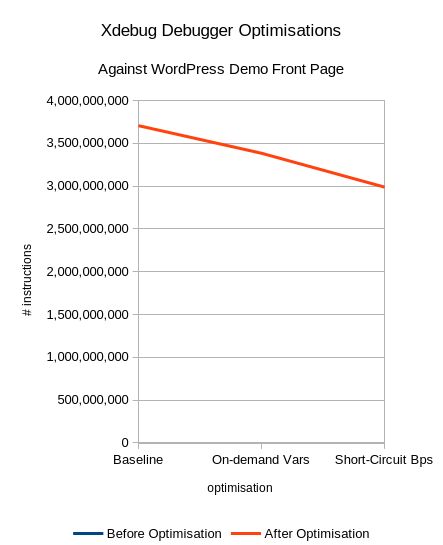
In the wake of checking out the Observer API, I also thought I should have a look at some performance improvements. For example, I noticed that Xdebug would always collect local variables with each function call. This is only really needed when showing local variables, in stack traces, or through the step debugger.
Another optimisation that I worked on was to optimise the way how function breakpoints are checked against. These breakpoints trigger when a function gets called, or returned from. This is not a feature that many people often use, but Xdebug would always do some work to be able to compare the configured breakpoints against a normalised function name reference.
These two optimisations together resulted in a 20% reduction in CPU instructions (roughly equivalent to execution time) with the front page of WordPress' demo site.
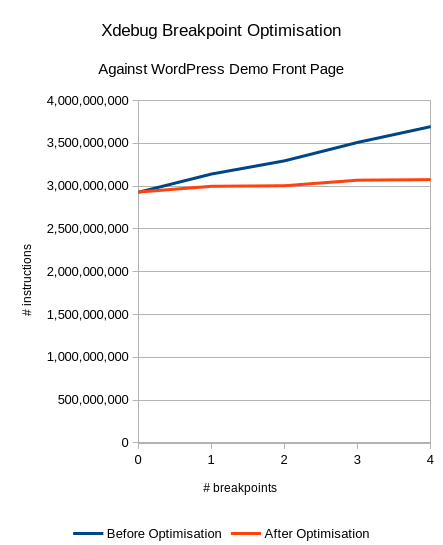
The third optimisation that I worked is related to file/line breakpoints. Xdebug would evaluate whether an IDE has set a line breakpoint on the current line. For this, it had to loop over all the existing breakpoints and compare them. Each additional breakpoint would be checked after every statement, meaning that the number of breakpoints affected the running time of the script.
My optimisation alleviates this by moving the check on whether line breakpoints exist for a function or method to the function call itself. If no breakpoints are set in the whole function, then Xdebug skips the check for line breakpoints after each statement. This shifts the factor of performance loss for having line breakpoints from the number of statements to the number of function calls. This shift results in a roughly 25% performance boost with only four line breakpoints enabled.
After attending IPC and speaking to fellow Xdebug users, a question came up about long running scripts. Right now, Xdebug's step debugger can only be activated when the script starts or by calling xdebug_connect_to_client(). Breakpoints can also only be configured when Xdebug is waiting for a command to continue a script (after a step, an existing breakpoint, or at the start of the script). While a script is running, you can not interrupt the execution to break, or add new breakpoints.
This let me to experiment with a control socket, currently only available on Linux. Through this socket you can then ask Xdebug for information, or request a breakpoint so that you can then use your IDE to add more breakpoints, or inspect the current state.
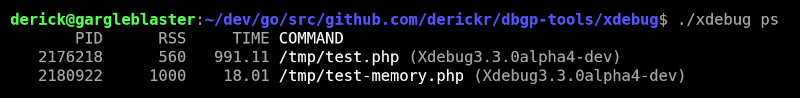
At the moment, I have implemented the "show me some information" feature, which allows me to show the running PHP scripts, with PID, memory usage (in kb), running time, and Xdebug version. The xdebug command line tool allows you to control Xdebug through the socket:
I have not merged this feature yet, but I hope to do so once I have the step debugger interruption feature as well.
Beyond this, I will continue to work on the features and issues on the 3.3 roadmap, without any guarantees these tickets will be implemented.
Xdebug Videos
I have not published any new videos in the last month, but I did record one. It is set to premiere on November 7th. To get notified, you can subscribe to my YouTube channel, or follow me or Xdebug on Mastodon.
Business Supporter Scheme and Funding
In the last month, no new business supporters signed up.
Besides business support, I also maintain a Patreon page, a profile on GitHub sponsors, as well as an OpenCollective organisation.
Xdebug Cloud
Xdebug Cloud is the Proxy As A Service platform to allow for debugging in more scenarios, where it is hard, or impossible, to have Xdebug make a connection to the IDE. It is continuing to operate as Beta release.
Packages start at £49/month, and I have recently introduced a package for larger companies. This has a larger initial set of tokens, and discounted extra tokens.
If you want to be kept up to date with Xdebug Cloud, please sign up to the mailinglist, which I will use to send out an update not more than once a month.


Life Line
Little Owl owlet
This lovely owlet was quite easy to find in a London Park, with some help as they camouflage so well!
I saw its sibling too.
#BirdPhotography #BirdsOfFediverse #Photography #Nature #London #BirdsOfMastodon

I went to a park (Bushy Park) to look for some owls.
I found Owls (Little and Tawny), but also a Green Woodpecker and two Kingfishers.
Snaps from my camera screen, and real photos will follow, but not of the Kingfishers as they were too far away and the photos are blurry.
#london #BirdPhotogaphy #BirdsOfMastodon #Birds #photography #BirdsOfFediverse #BushyPark

I hiked 13.8km in 4h44m12s
Created a chocolate shop and a restaurant; Updated 6 restaurants and an address; Confirmed 5 restaurants, a community_centre, and 3 other objects
Created a restaurant, a fast_food, and 2 other objects; Deleted a restaurant
I walked 8.5km in 1h31m45s
Created 2 buildings and a hairdresser shop; Updated a restaurant and an estate_agent office; Confirmed a cafe
I walked 2.2km in 38m09s
Merged pull request #1096
Bump actions/checkout from 6 to 7
Merged pull request #1095
Improve Tiverton Green mapping
Created 2 gates
I walked 7.1km in 1h23m15s
I walked 1.0km in 9m24s
Realign streets. They now have much less wide corners into each other.
Updated a fast_food
I walked 9.1km in 1h35m41s
I hiked 4.7km in 3h24m10s
I walked 6.7km in 1h12m03s
I walked 7.7km in 1h47m24s
Updated a pub
Updated a pub
Created a bar; Updated a bar; Confirmed a restaurant and a bar

Shortlink
This article has a short URL available: https://drck.me/xdebug-23oct-i3i