
Xdebug Update: May 2020
Another monthly update where I explain what happened with Xdebug development in this past month. These will be published on the first Tuesday after the 5th of each month. Patreon supporters will get it earlier, on the first of each month. You can become a patron to support my work on Xdebug. If you are leading a team or company, then it is also possible to support Xdebug through a subscription.
In May, I worked on Xdebug for about 70 hours, on the following things:
Xdebug 2.9.6
Continuing my new tradition of releasing at least one Xdebug release a month, in May I've released Xdebug 2.9.6. The main reason for the release is to fix a crash which would occur when classes in third party extensions would not implement PHP's internal "get_properties" API. This bug was found with the protobuf extension.
The second change is to add the SameSite attribute to the cookies that Xdebug maintains for multi-request debugging sessions. Because PHP's cookie setting API did not support this until PHP 7.3, neither will Xdebug. (So upgrade!).
And lastly, the 2.9.6 release addresses an inconsistency when path and branch information is returned with xdebug_get_code_coverage(), when enabled. Up to now, nothing made use of Xdebug's branch/path coverage yet, but PHP Unit will from this August's release have initial support for it. Xdebug 3 should also make code coverage (and other things) faster as well. Which brings me to the next item.
Xdebug 3
I have spent some time changing the way how you configure Xdebug's myriad of features. Xdebug has way too many configuration settings, and one of Xdebug 3's goal is to simplify its configuration, and at the same time improve performance.
With Xdebug 2.9 I have already split up and reorganised the code towards this, but with a soon-to-be-merged branch, you will no longer be able to enable both the step-debugger, code coverage, profiling, and/or tracing at the same time. The settings xdebug.default_enable, xdebug.remote_enable, xdebug.profiler_enable, xdebug.coverage_enable, and xdebug.auto_trace have been replaced with the xdebug.mode setting which can have the values off, display (for var_dump() override and stack traces), trace, debug, profile, and coverage.
Further more, the individual "trigger" features, either through cookies, function calls, environment variables, etc, have been replaced by a generic xdebug.start_with_request settings, which can have the values never, trigger, always, and default. The default value for the setting emulates Xdebug 2's behaviour.
As an example, where you previously used for code coverage:
xdebug.default_enable=0
xdebug.coverage_enable=1 # this was the default
You now use:
xdebug.mode=coverage
And you also won't have to think about setting xdebug.profiler_enable=0 and xdebug.auto_trace=0.
Similarly, for step-debugging with the debugger starting when you have a warning, error, or exception, you no longer use:
xdebug.remote_enable=1
xdebug.remote_mode=jit
But instead you use:
xdebug.mode=debug
xdebug.start_with_request=trigger
I have not written the documentation or upgrade guide for these changes yet, but I expect that to be finished in June, when I will also shift my focus to improvement the performance of each month.
Xdebug Cloud
I worked on Xdebug Cloud only a little in the beginning of the month, with a few minor things to iron out before it can be alpha tested by interested parties. If you've signed up to the Xdebug Cloud mailinglist I'll let you know as soon as something can be tried-out.
Business Supporter Scheme and Funding
In May, one new supporters signed up:
Thanks!
If you, or your company, would also like to support Xdebug, head over to the support page!
Besides business support, I also maintain a Patreon page and a profile on GitHub sponsors.


Life Line
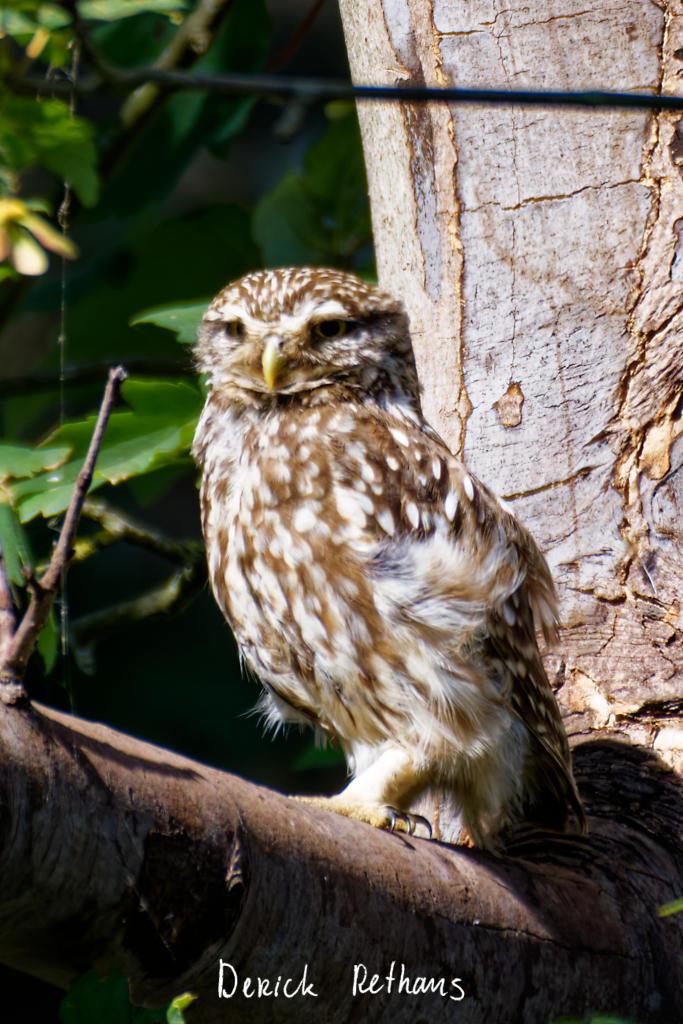
Little Owl owlet
This lovely owlet was quite easy to find in a London Park, with some help as they camouflage so well!
I saw its sibling too.
#BirdPhotography #BirdsOfFediverse #Photography #Nature #London #BirdsOfMastodon
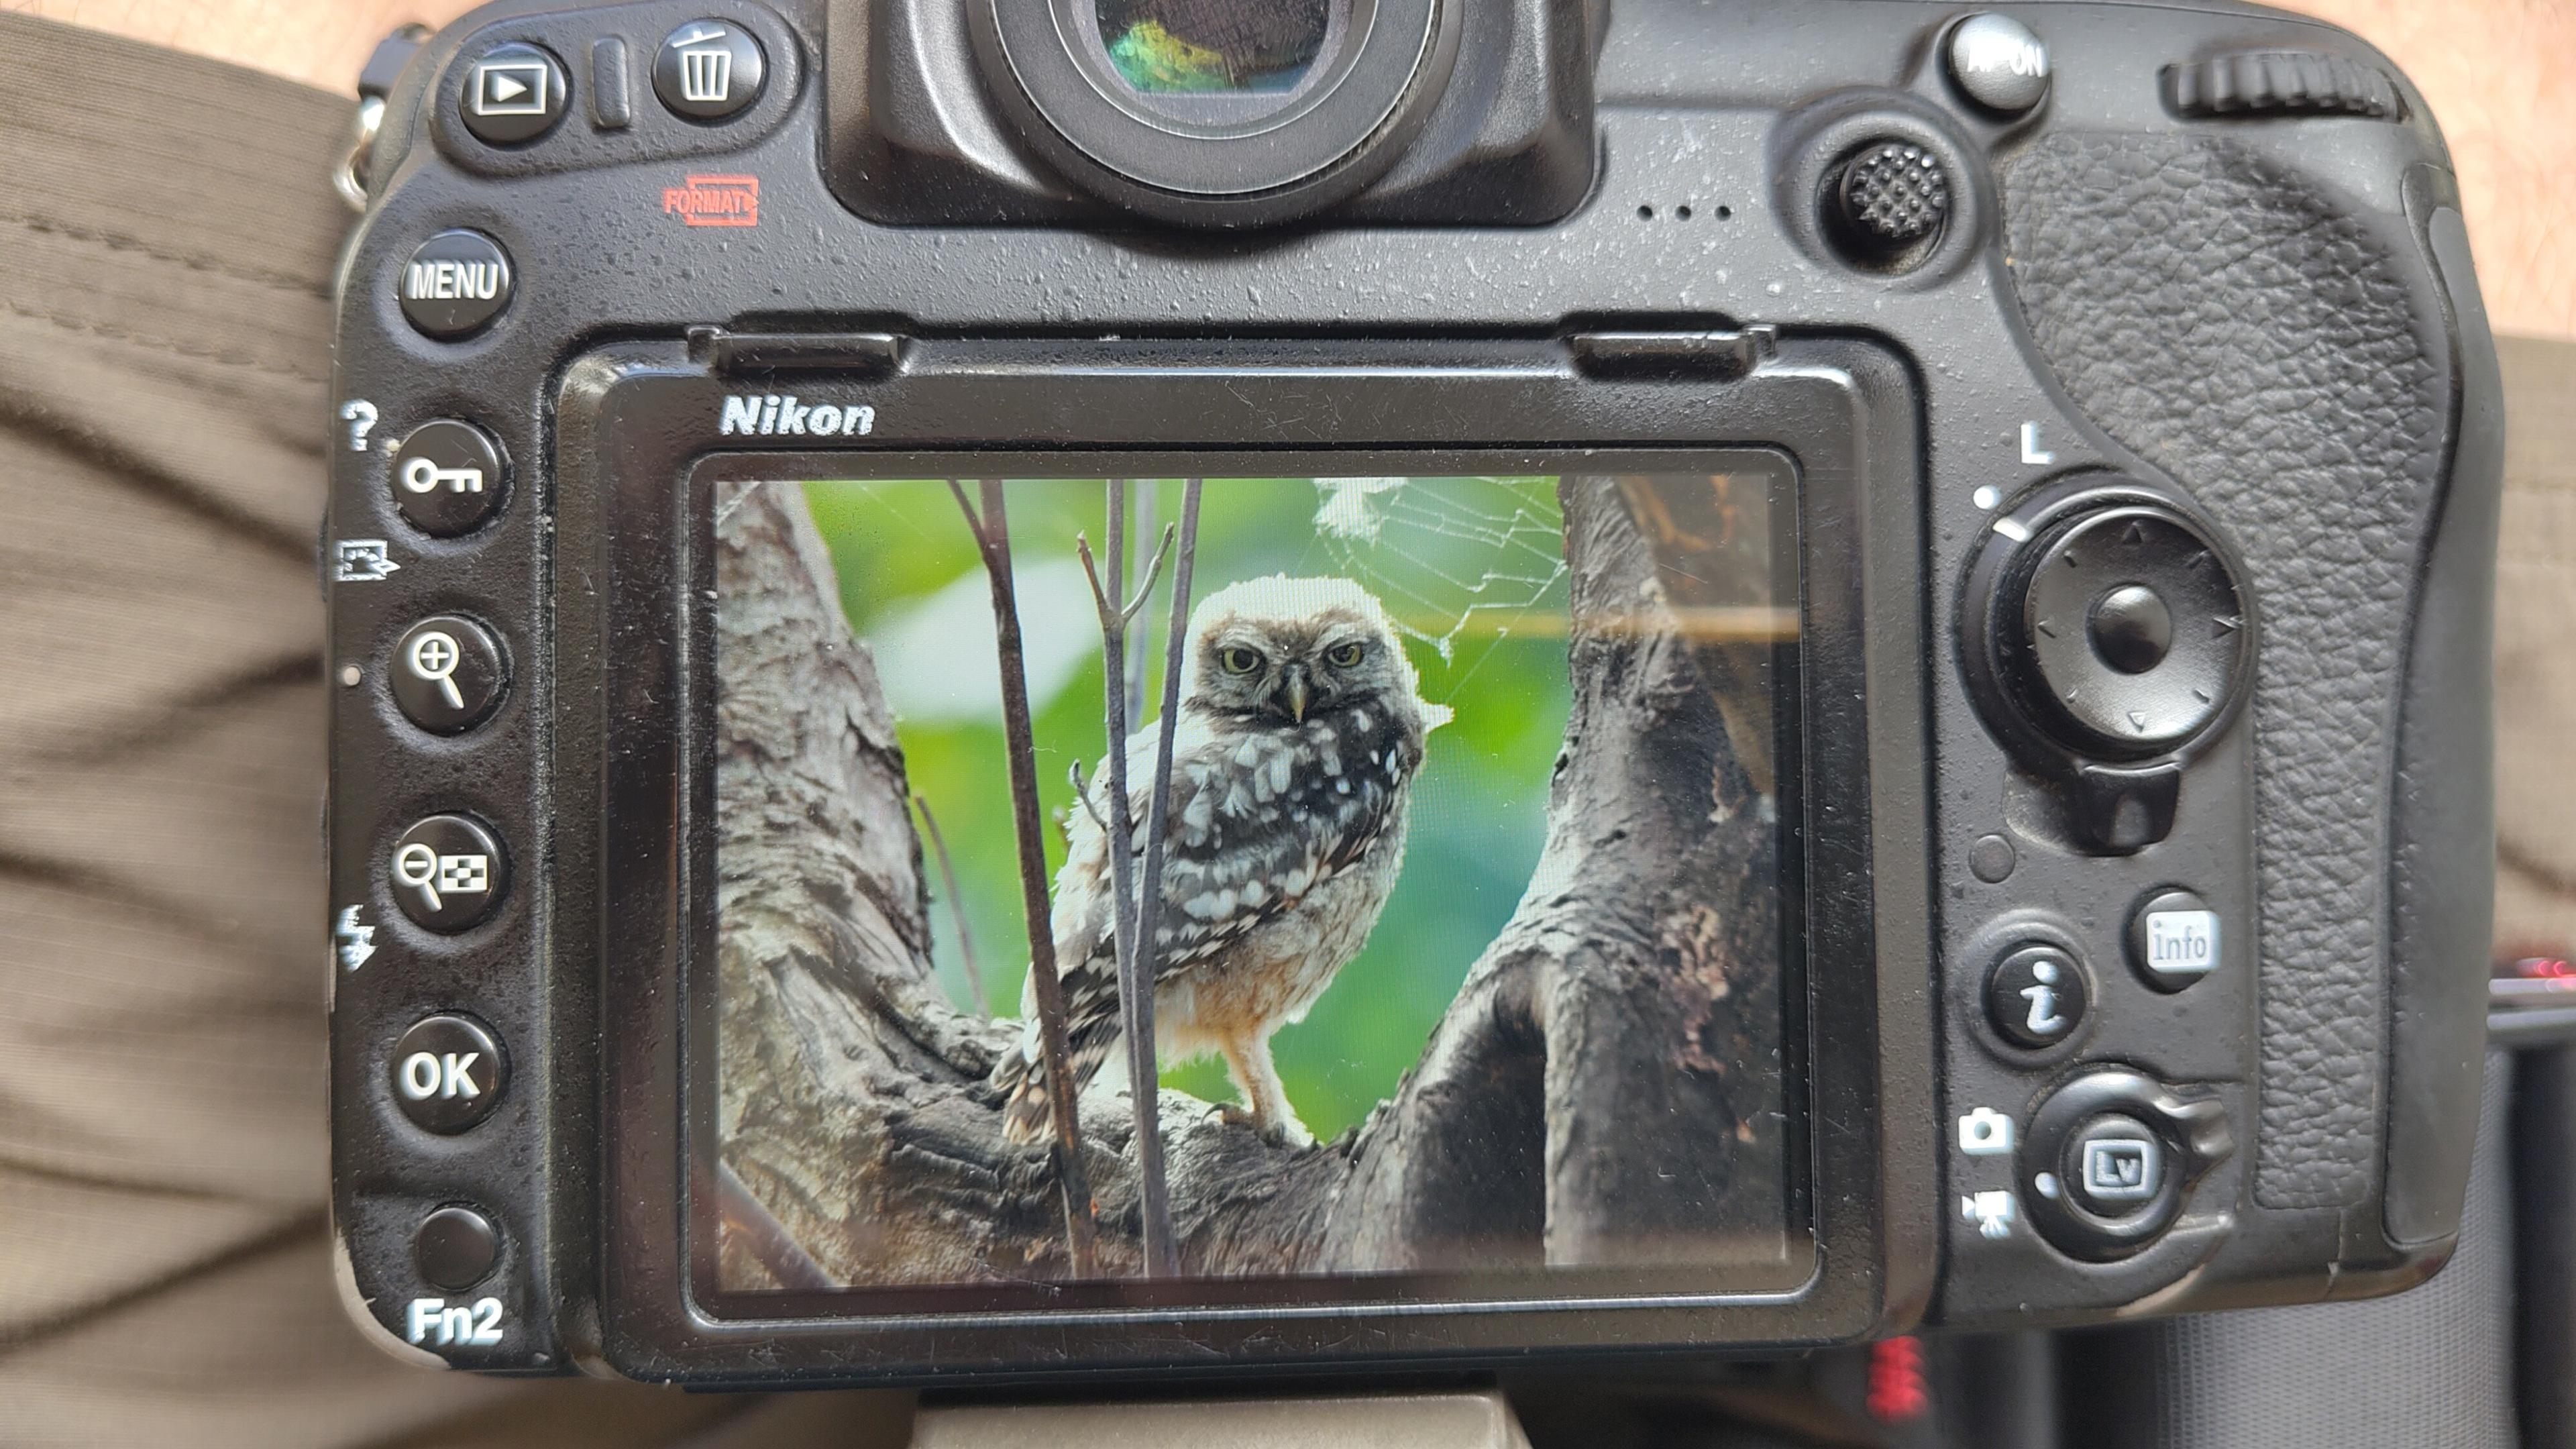
I went to a park (Bushy Park) to look for some owls.
I found Owls (Little and Tawny), but also a Green Woodpecker and two Kingfishers.
Snaps from my camera screen, and real photos will follow, but not of the Kingfishers as they were too far away and the photos are blurry.
#london #BirdPhotogaphy #BirdsOfMastodon #Birds #photography #BirdsOfFediverse #BushyPark
I hiked 13.8km in 4h44m12s
Created a chocolate shop and a restaurant; Updated 6 restaurants and an address; Confirmed 5 restaurants, a community_centre, and 3 other objects
Created a restaurant, a fast_food, and 2 other objects; Deleted a restaurant
I walked 8.5km in 1h31m45s
Created 2 buildings and a hairdresser shop; Updated a restaurant and an estate_agent office; Confirmed a cafe
I walked 2.2km in 38m09s
Merged pull request #1096
Bump actions/checkout from 6 to 7
Merged pull request #1095
Improve Tiverton Green mapping
Created 2 gates
I walked 7.1km in 1h23m15s
I walked 1.0km in 9m24s
Realign streets. They now have much less wide corners into each other.
Updated a fast_food
I walked 9.1km in 1h35m41s
I hiked 4.7km in 3h24m10s
I walked 6.7km in 1h12m03s
I walked 7.7km in 1h47m24s
Updated a pub
Updated a pub
Created a bar; Updated a bar; Confirmed a restaurant and a bar

Shortlink
This article has a short URL available: https://drck.me/xdebug-20may-fma