
Xdebug Update: July 2020
Another monthly update where I explain what happened with Xdebug development in this past month. These will be published on the first Tuesday after the 5th of each month. Patreon and GitHub supporters will get it earlier, on the first of each month. You can become a patron to support my work on Xdebug. If you are leading a team or company, then it is also possible to support Xdebug through a subscription.
In July, I worked on Xdebug for about 100 hours, with funding being around 70 hours. I worked mostly on the following things:
Xdebug 3
I spend nearly all of my time improving performance this month, with some help by Michael Voříšek for the profiler feature. Some of this work I have done live through Twitch where I stream (almost) every Monday at 15:30 BST (14:30 UTC/10:30 EDT). Past sessions are available on Vimeo.
In order to find out what can be improved I profiled Xdebug running various workloads. I have selected the following workloads per Xdebug mode
-
off: zetacomponents Document test suite
-
develop: "composer update" for Pimcore, "composer update" for ShopWare
-
coverage: PHPUnit test suite coverage
-
profiling: akt-ui
If you have any specific one you'd like to see added, please let me know and I'll see whether I have CPU cycles for it—running composer update for Pimcore under the C profiler Valgrind takes 2½ hours per run!
In any case, the profiling found out the following possible improvements:
Use zend_string for filenames and variable names
Most of Xdebug was written before PHP 7, and when updating Xdebug to work with both PHP 5 and PHP 7 certain PHP 5 APIs, wrapped in macros to make it work with PHP 7, remained in use by Xdebug. When dropping PHP 5 support, I did not update these APIs to use the PHP 7 variant. One of these APIs is that in PHP 5, strings were often passed around as a char string, size_t len pair. PHP 7 introduced a new data type zend_string str which encapsulates both elements of the pair, and also introduced reference counting for zend_string s, which reduces the need for duplication of memory. This gave about a ~2% performance boost to Wall Time (the time passage as indicated by a clock), and about a 5% reduction in CPU instructions.
Switch xdebug_sprintf to a new xdebug_str_add_fmt
Xdebug often needs to convert data into a single string, for either writing to file or network, storing function names with arguments in memory, or display purposes. It uses an API xdebug_sprintf which allocates new memory and formats the string according to format specifiers. Often it needs to add this to a xdebug_str buffer that makes up a longer piece of text. After it has added it to that buffer, it frees the allocated memory again.
By creating a new API that can add a formatted string to an xdebug_str buffer, I managed to reduce the amount of memory allocations and frees dramatically. This gave a 10-15% Wall Time performance boost, and a 10-25% reduction in CPU instructions.
Use a vector instead of a list for the stack
Xdebug's internals contain a stack of all the functions that are called. Every time a new function is called, a new stack level is allocated, and when the function ends this stack element is freed up. In applications which call a lot of small functions, such as Composer, this repeated allocation and freeing of memory, as well as the maintenance of the links in the list, is expensive.
I switched this list approach to use a Vector, which is a continuous amount of allocated memory, without the need for an allocation and free for every function that is being called. This gave a 2-6% Wall Time performance boost, most notably with Composer, and a 3-10% reduction in CPU instructions.
Buffering for the profiler
Most of the work on Xdebug's profiler were initiated by Michael Voříšek. The main performance boost was to use the new xdebug_str_add_fmt API, but also changing the initial size of xdebug_str buffers from 1 to 32, as most of the strings are of that length. This will use a bit more memory.
The other big part of the performance improvements for profiling is to no longer use fprintf and fflush a lot. Instead Xdebug now uses an xdebug_str, the new xdebug_str_add_fmt API, and also a new API function to format a number to an xdebug_str without having to use the xdebug_sprintf API call.
These, as well as the other mentioned changes reduced Wall Time, as well as CPU instructions, for profiling by about 40%.
I will continue to work on improving performance in September, but here are some graphs:
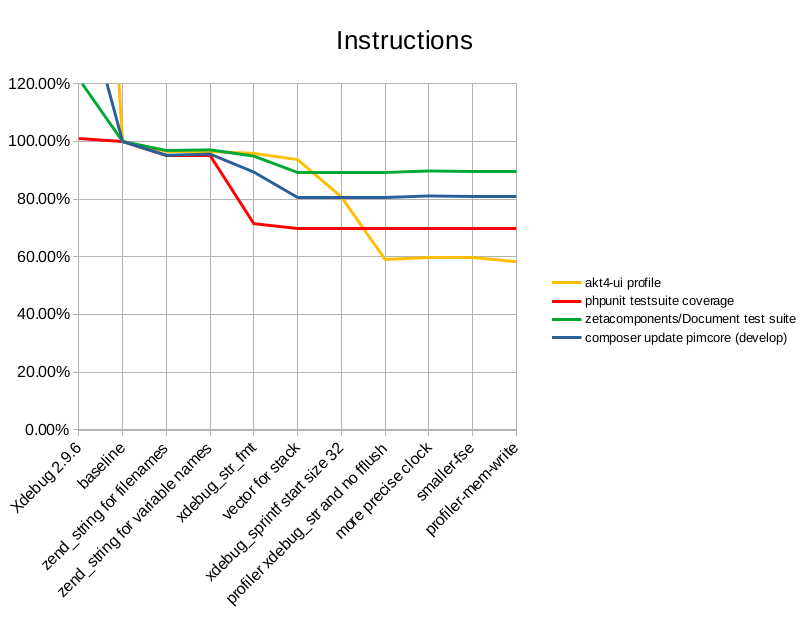
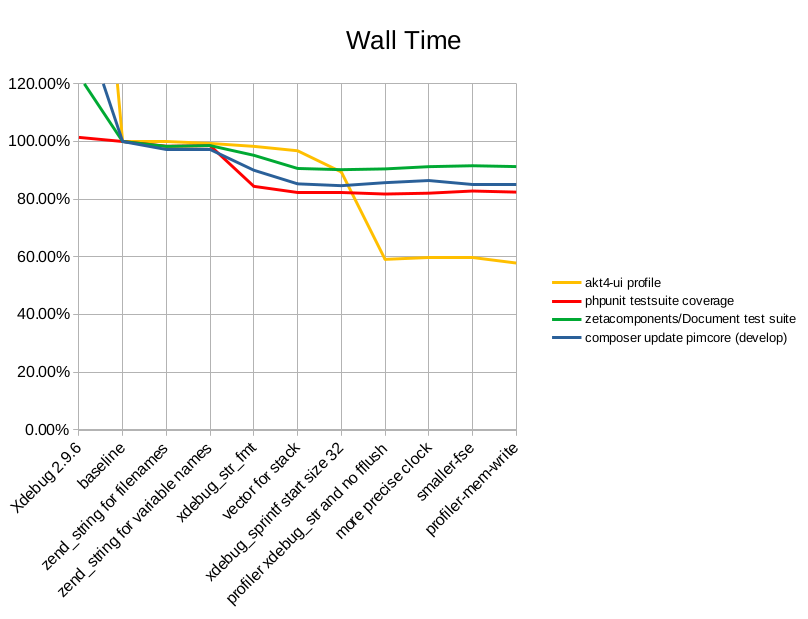
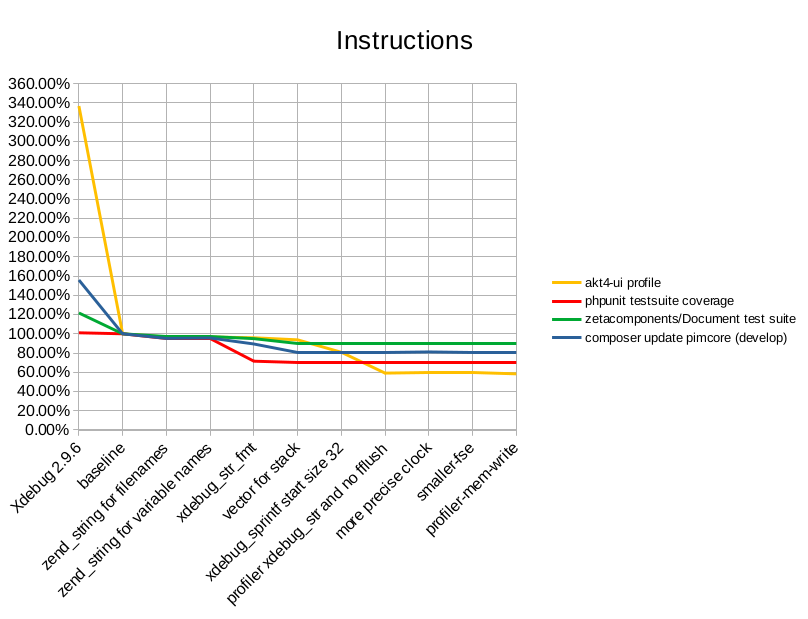
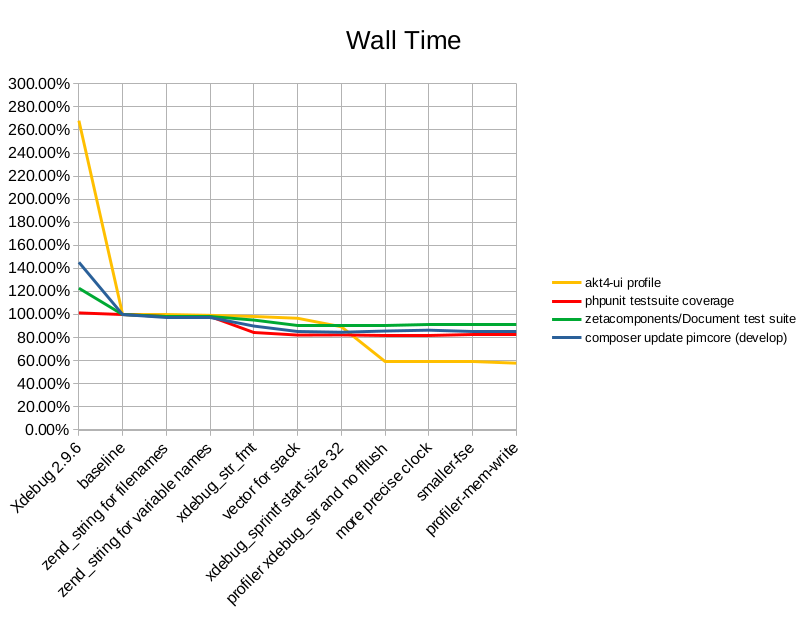
You might notice that the Xdebug 2.9.6 data is off the chart, here are they with Xdebug 2.9.6 included ;-)
Xdebug Cloud
The only time I spend in August on Xdebug Cloud is some further conversations with JetBrains. I am going to work on Xdebug Cloud returns in August, starting with a introductionary stream on Xdebug Cloud today at 15:30 BST on Twitch.
If you want to be kept up to date with Xdebug Cloud, please sign up to the mailinglist I'll let you know as soon as something can be tried-out.
Business Supporter Scheme and Funding
In July, no new supporters signed up.
If you, or your company, would also like to support Xdebug, head over to the support page!
Besides business support, I also maintain a Patreon page and a profile on GitHub sponsors.


Life Line
Little Owl owlet
This lovely owlet was quite easy to find in a London Park, with some help as they camouflage so well!
I saw its sibling too.
#BirdPhotography #BirdsOfFediverse #Photography #Nature #London #BirdsOfMastodon

I went to a park (Bushy Park) to look for some owls.
I found Owls (Little and Tawny), but also a Green Woodpecker and two Kingfishers.
Snaps from my camera screen, and real photos will follow, but not of the Kingfishers as they were too far away and the photos are blurry.
#london #BirdPhotogaphy #BirdsOfMastodon #Birds #photography #BirdsOfFediverse #BushyPark

I hiked 13.8km in 4h44m12s
Created a chocolate shop and a restaurant; Updated 6 restaurants and an address; Confirmed 5 restaurants, a community_centre, and 3 other objects
Created a restaurant, a fast_food, and 2 other objects; Deleted a restaurant
I walked 8.5km in 1h31m45s
Created 2 buildings and a hairdresser shop; Updated a restaurant and an estate_agent office; Confirmed a cafe
I walked 2.2km in 38m09s
Merged pull request #1096
Bump actions/checkout from 6 to 7
Merged pull request #1095
Improve Tiverton Green mapping
Created 2 gates
I walked 7.1km in 1h23m15s
I walked 1.0km in 9m24s
Realign streets. They now have much less wide corners into each other.
Updated a fast_food
I walked 9.1km in 1h35m41s
I hiked 4.7km in 3h24m10s
I walked 6.7km in 1h12m03s
I walked 7.7km in 1h47m24s
Updated a pub
Updated a pub
Created a bar; Updated a bar; Confirmed a restaurant and a bar

Shortlink
This article has a short URL available: https://drck.me/xdebug-20jul-fos