
Xdebug and tracing memory usage
Recently people started to ask me how to use Xdebug to figure out which parts of applications use a lot of memory. Traditionally this was part of Xdebug's profiling functionality. Unfortunately the cachegrind format didn't fit this so well, and because it returned incorrect data I removed this functionality from the profiler. However, there is other functionality in Xdebug that does provide the correct data: the function traces.
Function traces log every include, function call and method call to a file. If the xdebug.trace_format setting is set to "1" then the trace file is an easy-to-parse tab separated format. The information that is logged includes the time-index when the function started and ended, and it also contains the amount of memory that was in use when entering the function, as well as when leaving it. With the last two numbers it's rather trivial to write a script to figure out which functions/methods increase the memory usage a lot. Of course, nobody had written a script yet to do anything with this information
As part of my preparations for my Xdebug talk at IPC next week, I now have written such a script. The script parses the tab-separated function trace files and aggregates all the information by function name. You can sort the output on a few different keys: time-own, memory-own, time-inclusive, memory-inclusive and calls. You can also configure how many elements it will show. As an example here is some output from a trace of one of the presentation system's PHP scripts:
$ php tracefile-analyser.php trace.2043925204.xt memory-own 20
parsing...
Done.
Showing the 20 most costly calls sorted by 'memory-own'.
                                               Inclusive        Own
function                               #calls  time     memory  time     memory
-------------------------------------------------------------------------------
require_once                                9  0.0541  4595160  0.0277  2548104
{main}                                      1  0.0600  2906032  0.0034   249744
fread                                       4  0.0001    33296  0.0001    33296
session_start                               1  0.0002    31824  0.0002    31824
XML_Presentation->startHandler             38  0.0073    36360  0.0035    18424
_pres_slide->_pres_slide                   27  0.0009    10152  0.0009    10152
_presentation->_presentation                1  0.0001     7912  0.0001     7912
strtolower                                 67  0.0017     6456  0.0017     6456
compact                                     1  0.0000     4832  0.0000     4832
each                                        5  0.0001     4320  0.0001     4320
XML_Presentation->endHandler               38  0.0014     3800  0.0014     3960
_slide->_slide                              1  0.0001     3896  0.0001     3896
XML_Slide->startHandler                     4  0.0009    10800  0.0004     3736
_image->_image                              1  0.0000     3040  0.0000     3040
fopen                                       2  0.0001     2816  0.0001     2816
getimagesize                                1  0.0001     2296  0.0001     2296
display->display                            1  0.0001     2120  0.0001     2120
explode                                     2  0.0001     2120  0.0001     2120
xml_parser_create                           2  0.0001     1680  0.0001     1680
XML_Parser->_initHandlers                   2  0.0011     1600  0.0005     1360
The script is available in Xdebug's download package or at https://github.com/derickr/xdebug/raw/master/contrib/tracefile-analyser.php
The script to run is then "tracefile-analyser.php" from inside the "xdebug/contrib" directory.
Update 2009-12-28: Changed the CVS instructions to the new SVN instructions.
Update 2012-03-13: Changed the SVN instructions to a link to github.

Comments
can you put link to direct download?
@johnathan: You can get it from the CVS browser:
Checked out the code from your cvs, but there is a syntax error on the file xdebug/contrib/api/parser.php :-(
@Pratheesh: The script is PHP 5.3 only, because it uses a closure.
Hello,
Very interesting script. But I've been triing to checkout all the day, in vain. Is your server down or is there an error in the command you gave: "svn co svn://svn.xdebug.org:/svn/xdebug/xdebug/trunk/contrib".
Thanks by advance for your answer. And your work off course.
Greetings from France. Jérôme.
@Jérôme: It works just fine here. Perhaps you can try this as well though:
svn co svn://svn.xdebug.org/svn/xdebug/xdebug/trunk/contrib
Thanks for your answer.
In fact, it was just a problem of closed port from my side, solved now.
;]
Greetings from France.
Jérôme.
Derick,
I downloaded the tracefile-analyser.php when you originally posted it, but after running it here locally I started seeing negative results for memory-own. Do you know why this would be?
I checked out the latest version from your SVN, and looking at the changes that were been made I can see that in the latest version the class defition for drXdebugTraceFileParser has been removed, but it's still referenced in tracefile-analyser.php; perhaps it was intended to be included from the empty /api directory?
Thanks in advance for any help!
@Ken: It has not been removed; it has been added! In the latest SVN version, is really part of the same tracefile-analyser.php script: http://svn.xdebug.org/cgi-bin/viewvc.cgi/xdebug/trunk/contrib/tracefile-analyser.php?view=markup&revision=3296&root=xdebug#l65
My mistake! I missed a line. My main reason for posting though was to inquire about the negative metrics; have you experience this, or had any other reports? The negative memory usage is coming from both native PHP functions as well as userland functions.
Nice script!
May I know the representation of memory, i mean whether it represented in KB o MB?
@rgami: It's in bytes luckily.
Thanks for the awesome script. I made a slight modification so I could use it with PHP 5.2, and thought I would share:
Greetings Derick! can you explain the difference between the 2 column - Inclusive and Own or kindly provide further information on how to interpret the report generated by the script. :)
James, thank you! Your script is work with a PHP 5.2.17
I am using this to attempt to find a memory leak. However, I am having trouble with the fact that memory-own, seems to include variable assignments that are the result of a function call.
So for example, the following code will show str_replace as being a the top user of memory, simply because it repeatedly assigns code to a variable -- even though that variable is not stored in memory anywhere
- for( $i=0; $i<10; $i++ ) {
-
foo( 'apple' );
}
- function foo( $string ) {
-
$bar = str_replace( 'a', 'b', $string );
}
This means that when trying to find the leak, my results are cluttered with calls to functions that simply are called many times, hiding the real issues. Any suggestions as to what I might try to get around this?
Thanks!
I tried running the script but I am getting error :
# php tracefile-analyzer.php tmptrace.3227665190.xt memory-own 20
- This file is not an Xdebug trace file made with format option '1' and version 2 to 4. usage:
-
php run-cli tracefile [sortkey] [elements]
- Allowed sortkeys:
-
calls, time-inclusive, memory-inclusive, time-own, memory-own
paste at https://www.dropbox.com/s/1ex907rjk0r69lx/trace.3227665190.xt?dl=0

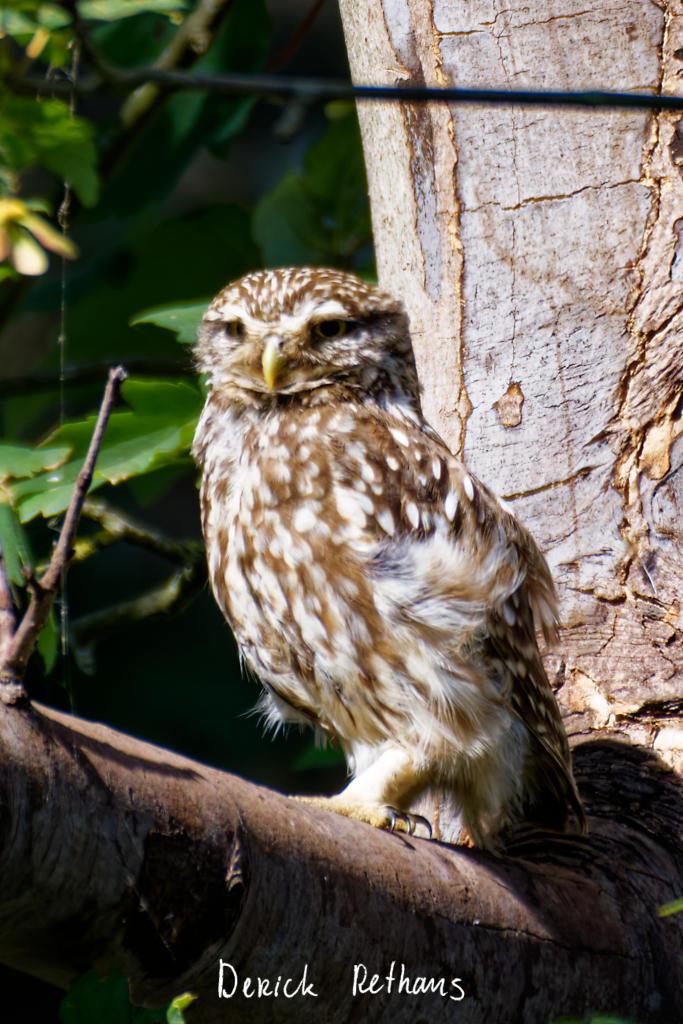
Life Line
Little Owl owlet
This lovely owlet was quite easy to find in a London Park, with some help as they camouflage so well!
I saw its sibling too.
#BirdPhotography #BirdsOfFediverse #Photography #Nature #London #BirdsOfMastodon
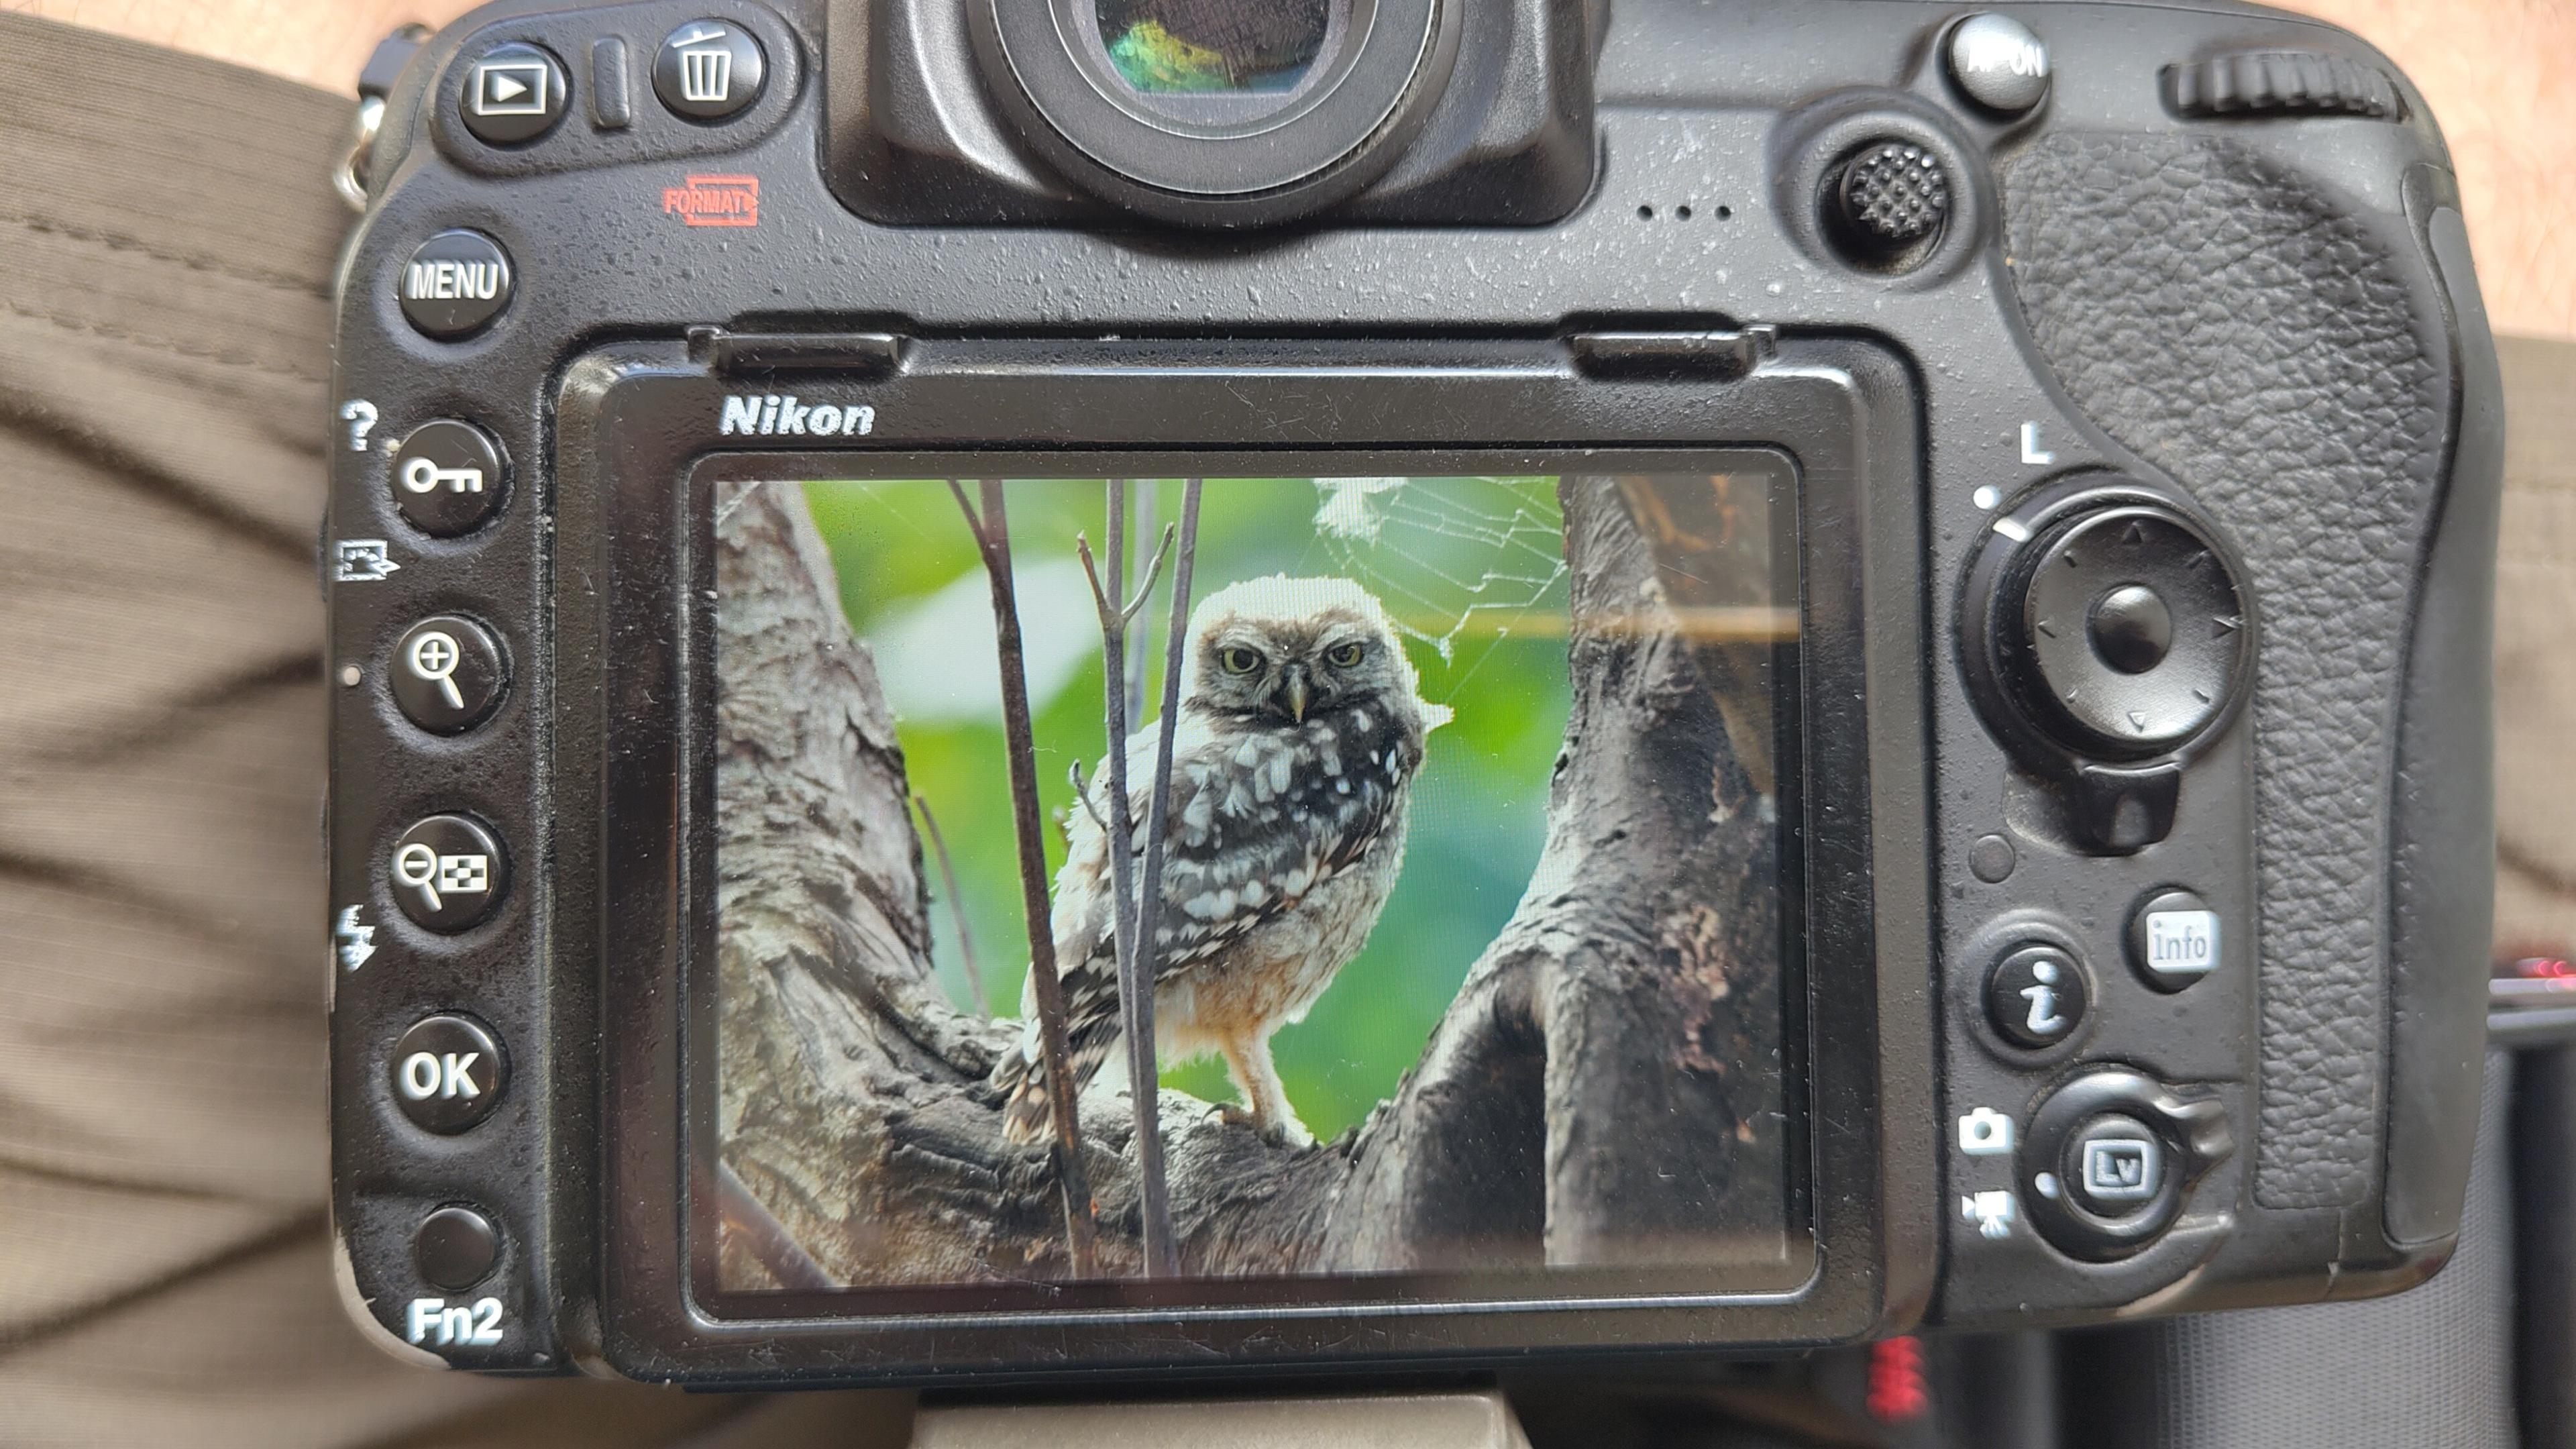
I went to a park (Bushy Park) to look for some owls.
I found Owls (Little and Tawny), but also a Green Woodpecker and two Kingfishers.
Snaps from my camera screen, and real photos will follow, but not of the Kingfishers as they were too far away and the photos are blurry.
#london #BirdPhotogaphy #BirdsOfMastodon #Birds #photography #BirdsOfFediverse #BushyPark
I hiked 13.8km in 4h44m12s
Created a chocolate shop and a restaurant; Updated 6 restaurants and an address; Confirmed 5 restaurants, a community_centre, and 3 other objects
Created a restaurant, a fast_food, and 2 other objects; Deleted a restaurant
I walked 8.5km in 1h31m45s
Created 2 buildings and a hairdresser shop; Updated a restaurant and an estate_agent office; Confirmed a cafe
I walked 2.2km in 38m09s
Merged pull request #1096
Bump actions/checkout from 6 to 7
Merged pull request #1095
Improve Tiverton Green mapping
Created 2 gates
I walked 7.1km in 1h23m15s
I walked 1.0km in 9m24s
Realign streets. They now have much less wide corners into each other.
Updated a fast_food
I walked 9.1km in 1h35m41s
I hiked 4.7km in 3h24m10s
I walked 6.7km in 1h12m03s
I walked 7.7km in 1h47m24s
Updated a pub
Updated a pub
Created a bar; Updated a bar; Confirmed a restaurant and a bar

Shortlink
This article has a short URL available: https://drck.me/xdebug-atmu-7ax