
Xdebug 2.1.1
I've just released Xdebug 2.1.1. It is a bug fix release that primarily addresses issues in the debugging and profiling functionality of Xdebug.
Among the bug fixes is a fix that solves an issue with newer versions of the KCacheGrind profiling GUI. The newer versions are more strict with input which causes an issue with Xdebug profiler's files. Xdebug 2.1.1 solves this.
As an experiment I set up a pledge system to allow myself to work on this (and related issues) during my "work time". Twenty-four pledges were made, in about two weeks; matching the goal. Sebastian, Jan, Michael, Pale Purple, Jeff, Christoph, Karel, Yannick, Jake, Venakis, Brian, Simon, Kenneth, DM Baker, "gizmola", Ladislav, Volker, React, Michal and three anonymous supporters—thanks for your support!
Another main issue that was fixed was that line numbers (in function traces, profile files and while debugging) for "magic" function calls (such as __get(), __call() etc) were always recorded as 0. This made it impossible to set breakpoints for example.
You can find Xdebug 2.1.1's source and Windows binaries at the download page. A full ChangeLog is available as well. Through twitter you can kept up-to-date about Xdebug's development efforts and support is available through the mailinglist. If you think that Xdebug is a valuable tool, you can donate via PayPal.


Life Line
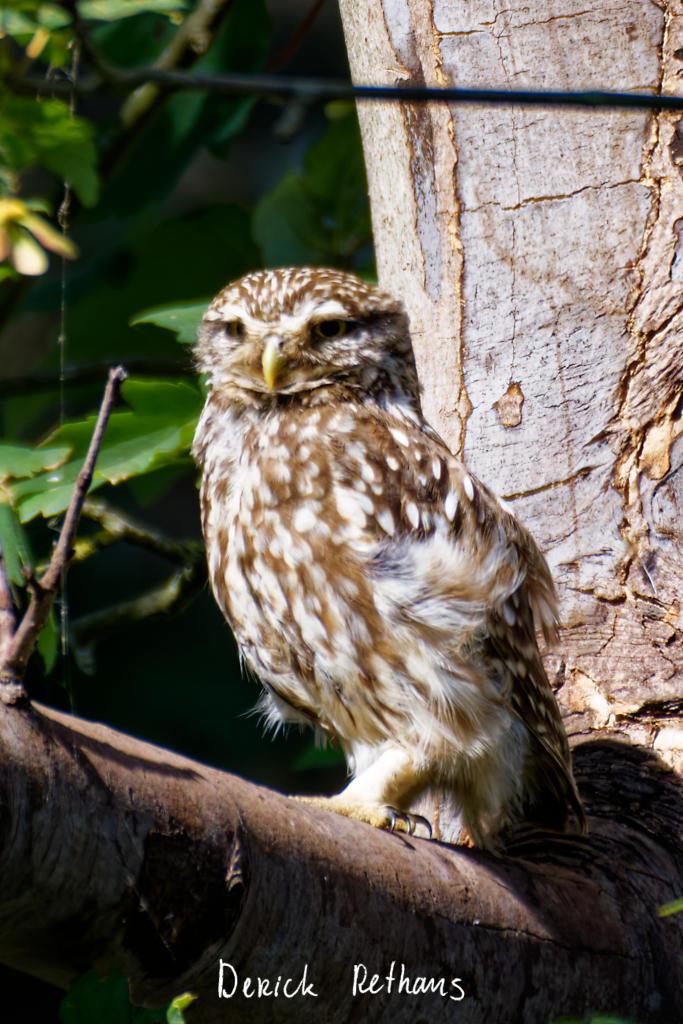
Little Owl owlet
This lovely owlet was quite easy to find in a London Park, with some help as they camouflage so well!
I saw its sibling too.
#BirdPhotography #BirdsOfFediverse #Photography #Nature #London #BirdsOfMastodon
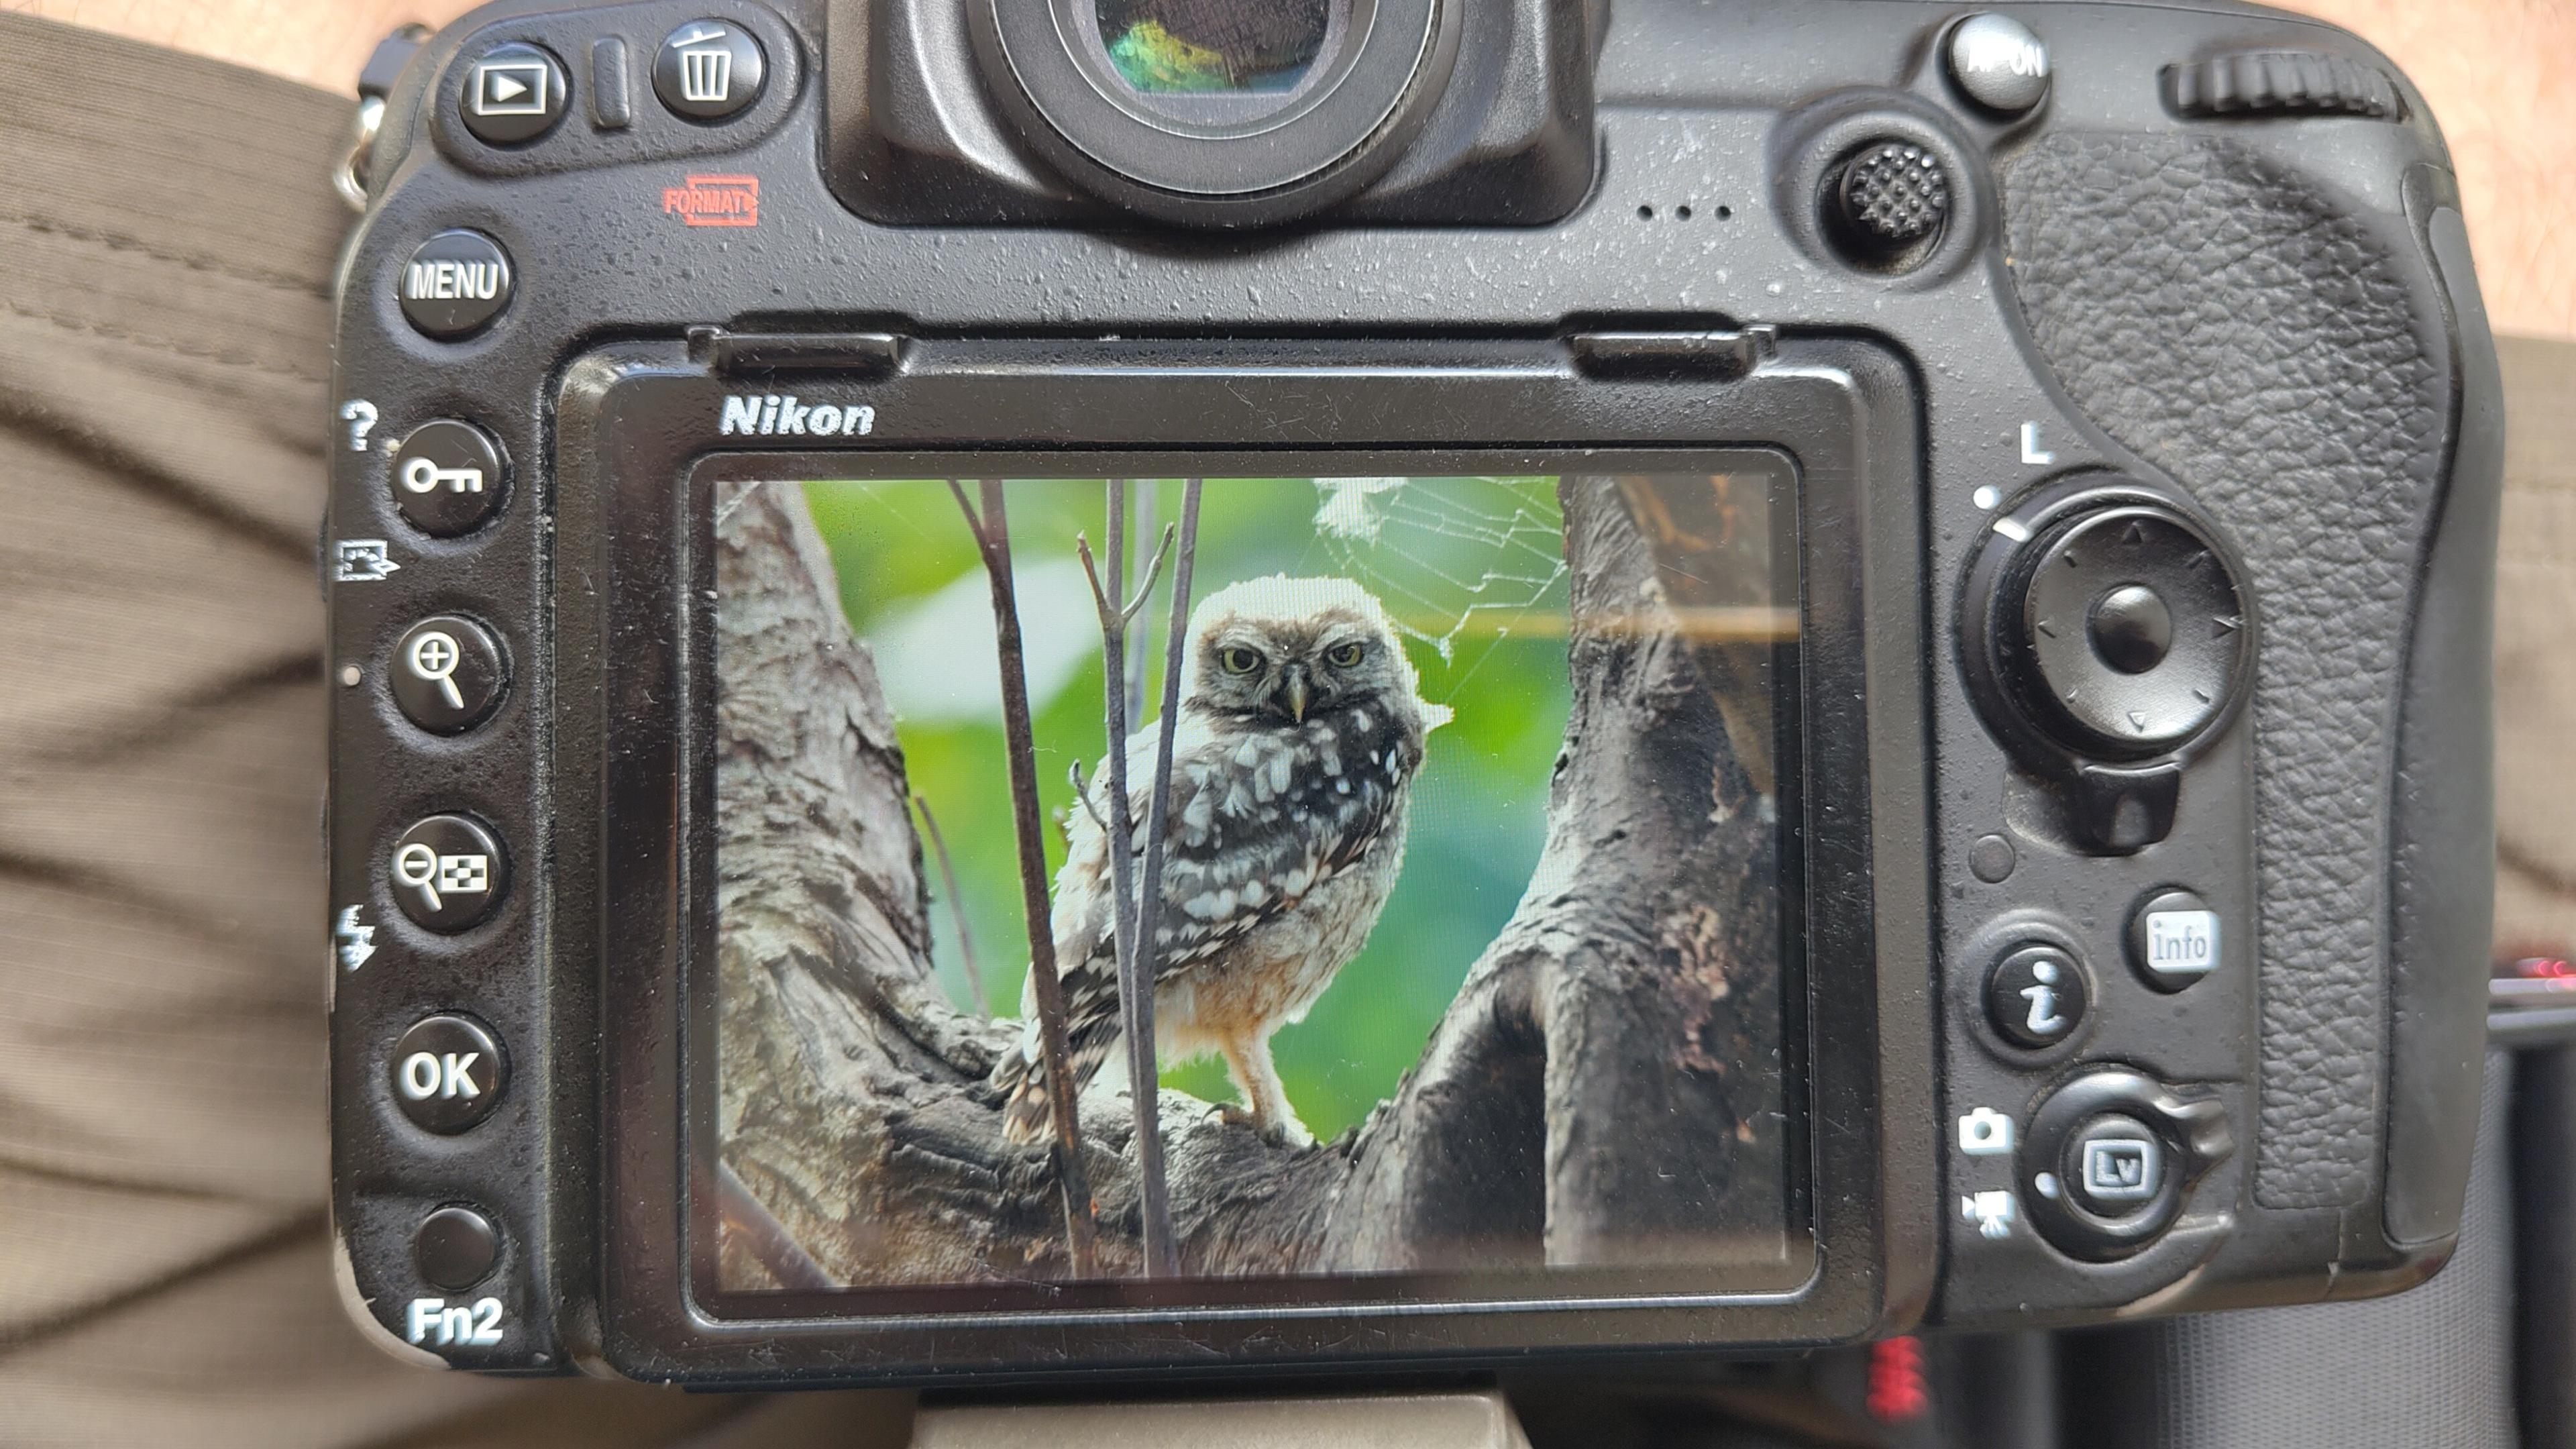
I went to a park (Bushy Park) to look for some owls.
I found Owls (Little and Tawny), but also a Green Woodpecker and two Kingfishers.
Snaps from my camera screen, and real photos will follow, but not of the Kingfishers as they were too far away and the photos are blurry.
#london #BirdPhotogaphy #BirdsOfMastodon #Birds #photography #BirdsOfFediverse #BushyPark
I hiked 13.8km in 4h44m12s
Created a chocolate shop and a restaurant; Updated 6 restaurants and an address; Confirmed 5 restaurants, a community_centre, and 3 other objects
Created a restaurant, a fast_food, and 2 other objects; Deleted a restaurant
I walked 8.5km in 1h31m45s
Created 2 buildings and a hairdresser shop; Updated a restaurant and an estate_agent office; Confirmed a cafe
I walked 2.2km in 38m09s
Merged pull request #1096
Bump actions/checkout from 6 to 7
Merged pull request #1095
Improve Tiverton Green mapping
Created 2 gates
I walked 7.1km in 1h23m15s
I walked 1.0km in 9m24s
Realign streets. They now have much less wide corners into each other.
Updated a fast_food
I walked 9.1km in 1h35m41s
I hiked 4.7km in 3h24m10s
I walked 6.7km in 1h12m03s
I walked 7.7km in 1h47m24s
Updated a pub
Updated a pub
Created a bar; Updated a bar; Confirmed a restaurant and a bar

Shortlink
This article has a short URL available: https://drck.me/xdebug-211-8l7