
Memory Madness
I'm currently preparing Xdebug for its 2.7.0rc1 release, the first (and hopefully last) release candidate. There is one issue left to do, and that is the one I have been working on in the last days.
The crash popped up when running the Zeta Components test suite for the Document component. And it manifests itself through a Segmentation Fault:
derick@gargleblaster:~/dev/zetacomponents-document$ php  ~/phpunit-5.7.22.phar
PHPUnit 5.7.22 by Sebastian Bergmann and contributors.

.............................................................   61 / 1198 (  5%)
...............................S.............................  122 / 1198 ( 10%)
..............................................E......Segmentation fault
When running it from within gdb, we see:
.............................................................   61 / 1198 (  5%)
...............................S.............................  122 / 1198 ( 10%)
..............................................E..............  183 / 1198 ( 15%)
...............S.....S.....SS................................  244 / 1198 ( 20%)
...................................E.......F.................  305 / 1198 ( 25%)
..........E..................F..E............................  366 / 1198 ( 30%)
.............................................................  427 / 1198 ( 35%)
..................................
Program received signal SIGSEGV, Segmentation fault.
0x00007ffff17a96fb in zval_get_type (pz=0x42) at /usr/local/php/7.3.0/include/php/Zend/zend_types.h:411
411             return pz->u1.v.type;
(gdb) bt
#0  0x00007ffff17a96fb in zval_get_type (pz=0x42) at /usr/local/php/7.3.0/include/php/Zend/zend_types.h:411
#1  0x00007ffff17ad2dc in xdebug_var_export (struc=0x7fffffff7c68, str=0x555558f36490, level=1, debug_zval=0, options=0x5555590c3cc0) at /home/derick/dev/php/xdebug-xdebug/xdebug_var.c:974
#2  0x00007ffff17ad812 in xdebug_get_zval_value (val=0x555559180120, debug_zval=0, options=0x5555590c3cc0) at /home/derick/dev/php/xdebug-xdebug/xdebug_var.c:1059
#3  0x00007ffff17a1f11 in add_single_value (str=0x7fffffff7dd0, zv=0x555559180120, html=0, collecton_level=4) at /home/derick/dev/php/xdebug-xdebug/xdebug_stack.c:371
#4  0x00007ffff17a23dd in xdebug_append_printable_stack (str=0x7fffffff7dd0, html=0) at /home/derick/dev/php/xdebug-xdebug/xdebug_stack.c:451
#5  0x00007ffff1782089 in xdebug_throw_exception_hook (exception=0x7fffe96ae200) at /home/derick/dev/php/xdebug-xdebug/xdebug.c:1586
But these errors can sometimes be misleading. As you can see, the error now happens a bit later during the test run.
In these cases, I usually use Valgrind instead, as it gives a warning as soon as a memory issue occurs, such as a use-after-free situation, or when reading uninitialised memory.
Running the tests with Valgrind however, gave very strange results:
derick@gargleblaster:~/dev/zetacomponents-document$ valgrind php ~/phpunit-5.7.22.phar --filter ezcDocumentConverterDocbookToRstTests::testLoadXmlDocumentFromFile
==38610== Memcheck, a memory error detector
==38610== Copyright (C) 2002-2015, and GNU GPL'd, by Julian Seward et al.
==38610== Using Valgrind-3.12.0.SVN and LibVEX; rerun with -h for copyright info
==38610== Command: php /home/derick/phpunit-5.7.22.phar --filter ezcDocumentConverterDocbookToRstTests::testLoadXmlDocumentFromFile
==38610==
==38610== Conditional jump or move depends on uninitialised value(s)
==38610==    at 0x4035D2A: ???
==38610==    by 0x13E352D7: ???
==38610==    by 0x13E352D7: ???
==38610==    by 0x13E352F6: ???
==38610==    by 0xB102CCF: ???
==38610==    by 0x13E352D7: ???
==38610==
==38610== Conditional jump or move depends on uninitialised value(s)
==38610==    at 0x4035D2A: ???
==38610==    by 0x13EE3BA7: ???
==38610==    by 0x13EE3BA7: ???
==38610==    by 0x13EE3BC6: ???
==38610==    by 0xB102CCF: ???
==38610==    by 0x13EE3BA7: ???
Normally, these ??? items contain the name of C functions, but in this case, they are all unknown. That often means that Valgrind does not have the right debugging symbols available. After checking whether I had these installed, I found that I did have the debugging symbols available. Another point is that usually, at least there is some recognisable name present in stack traces for uninitialised value(s).
I first thought I had a bug in Valgrind, or perhaps the packaging was not done right for my Linux distribution. I know somebody who works on Valgrind, so I asked on IRC whether he knew what was up. Beyond the debugging symbols, he couldn't provide additional suggestions either. But Nicolás Álvarez, who was also hanging out in the channel, asked whether PHP has a JIT engine. I answered that it doesn't (yet), and then the light bulb went off: Although PHP itself does not have a JIT, the PCRE regular expression engine that PHP uses does.
After disabling PCRE's JIT with -dpcre.jit=0, the Valgrind output is now what I expect—with just the memory error that I thought was happening:
derick@gargleblaster:~/dev/zetacomponents-document$ valgrind php -dpcre.jit=0 ~/phpunit-5.7.22.phar --filter ezcDocumentConverterDocbookToRstTests::testLoadXmlDocumentFromFile
==38648== Memcheck, a memory error detector
==38648== Copyright (C) 2002-2015, and GNU GPL'd, by Julian Seward et al.
==38648== Using Valgrind-3.12.0.SVN and LibVEX; rerun with -h for copyright info
==38648== Command: php -dpcre.jit=0 /home/derick/phpunit-5.7.22.phar --filter ezcDocumentConverterDocbookToRstTests::testLoadXmlDocumentFromFile
==38648==
PHPUnit 5.7.22 by Sebastian Bergmann and contributors.

.....==38648== Invalid read of size 4
==38648==    at 0xB63E37E: xdebug_zend_hash_is_recursive (xdebug_compat.c:260)
==38648==    by 0xB65F1CF: xdebug_var_export (xdebug_var.c:965)
==38648==    by 0xB65F811: xdebug_get_zval_value (xdebug_var.c:1059)
==38648==    by 0xB653F10: add_single_value (xdebug_stack.c:371)
==38648==    by 0xB6543DC: xdebug_append_printable_stack (xdebug_stack.c:451)
==38648==    by 0xB634088: xdebug_throw_exception_hook (xdebug.c:1586)
==38648==    by 0x9BF803: zend_throw_exception_internal (zend_exceptions.c:166)
==38648==    by 0x9C3413: zend_throw_exception_object (zend_exceptions.c:1046)
==38648==  Address 0x1426f774 is 4 bytes inside a block of size 56 free'd
==38648==    at 0x4C2CDDB: free (vg_replace_malloc.c:530)
==38648==    by 0x95E07A: _efree (zend_alloc.c:2508)
==38648==    by 0x9A95C3: zend_array_destroy (zend_hash.c:1513)
==38648==    by 0x99043A: zend_array_destroy_wrapper (zend_variables.c:90)
==38648==    by 0x9902C5: rc_dtor_func (zend_variables.c:65)
==38648==    by 0x9ED835: zend_assign_to_variable (zend_execute.h:108)
==38648==    by 0xA54307: ZEND_ASSIGN_SPEC_CV_VAR_RETVAL_UNUSED_HANDLER (zend_vm_execute.h:45824)
==38648==    by 0x9FA722: ZEND_USER_OPCODE_SPEC_HANDLER (zend_vm_execute.h:1829)
==38648==  Block was alloc'd at
==38648==    at 0x4C2BBAF: malloc (vg_replace_malloc.c:299)
==38648==    by 0x95ECFF: __zend_malloc (zend_alloc.c:2904)
==38648==    by 0x95DFD3: _emalloc (zend_alloc.c:2494)
==38648==    by 0x9AAAAA: zend_array_dup (zend_hash.c:1923)
==38648==    by 0xA5664A: ZEND_ASSIGN_DIM_SPEC_CV_UNUSED_OP_DATA_CV_HANDLER (zend_vm_execute.h:47041)
==38648==    by 0x9FA722: ZEND_USER_OPCODE_SPEC_HANDLER (zend_vm_execute.h:1829)
==38648==    by 0xA5F7D9: execute_ex (zend_vm_execute.h:55557)
==38648==    by 0xB634E90: xdebug_execute_ex (xdebug.c:1876)
And with the insight this gave me, I can now attempt to find and fix the bug, and finally release Xdebug 2.7.0rc1.


Life Line
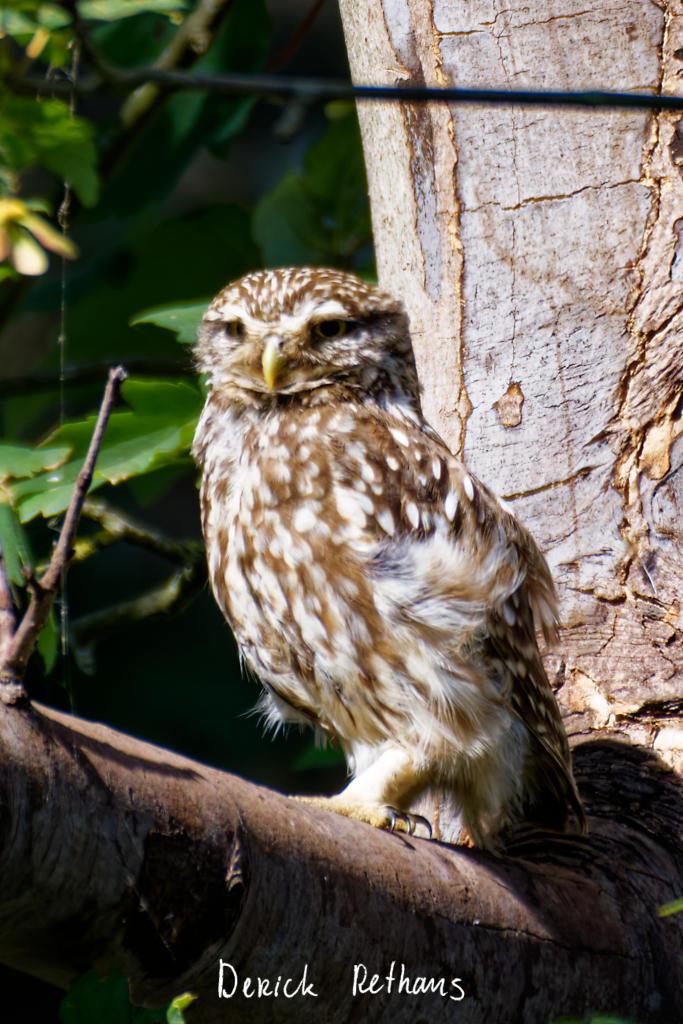
Little Owl owlet
This lovely owlet was quite easy to find in a London Park, with some help as they camouflage so well!
I saw its sibling too.
#BirdPhotography #BirdsOfFediverse #Photography #Nature #London #BirdsOfMastodon
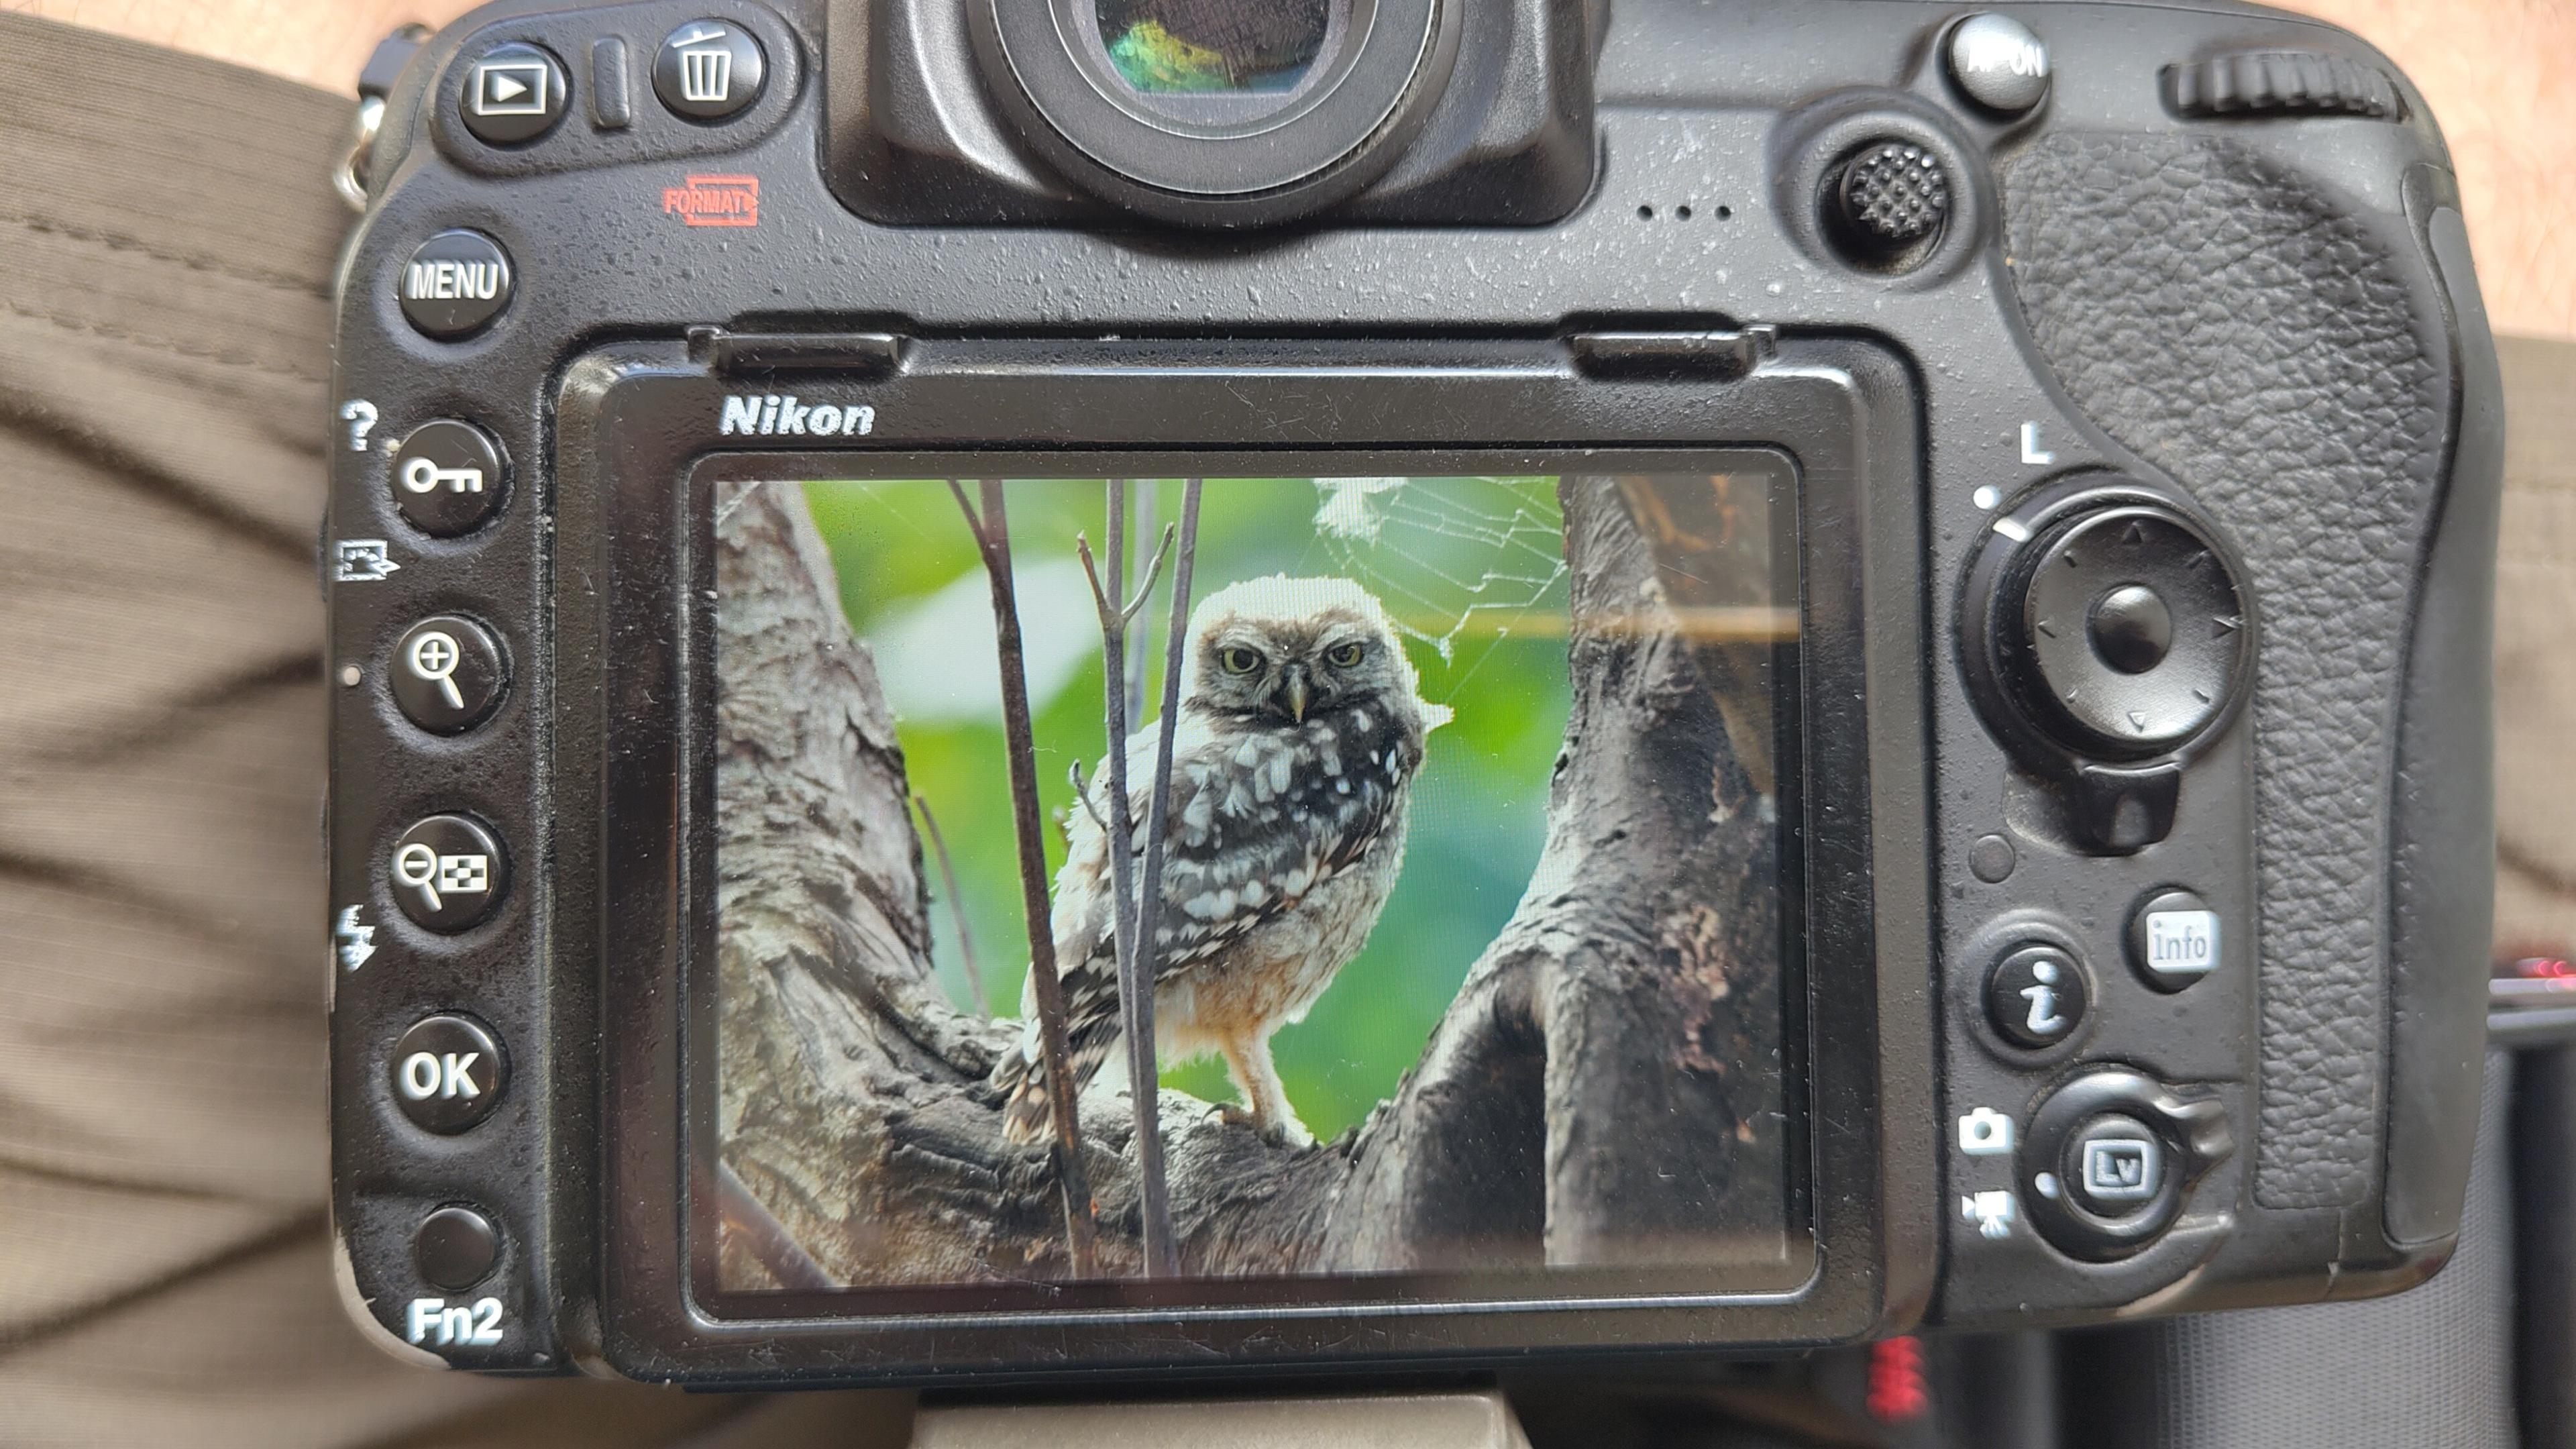
I went to a park (Bushy Park) to look for some owls.
I found Owls (Little and Tawny), but also a Green Woodpecker and two Kingfishers.
Snaps from my camera screen, and real photos will follow, but not of the Kingfishers as they were too far away and the photos are blurry.
#london #BirdPhotogaphy #BirdsOfMastodon #Birds #photography #BirdsOfFediverse #BushyPark
I hiked 13.8km in 4h44m12s
Created a chocolate shop and a restaurant; Updated 6 restaurants and an address; Confirmed 5 restaurants, a community_centre, and 3 other objects
Created a restaurant, a fast_food, and 2 other objects; Deleted a restaurant
I walked 8.5km in 1h31m45s
Created 2 buildings and a hairdresser shop; Updated a restaurant and an estate_agent office; Confirmed a cafe
I walked 2.2km in 38m09s
Merged pull request #1096
Bump actions/checkout from 6 to 7
Merged pull request #1095
Improve Tiverton Green mapping
Created 2 gates
I walked 7.1km in 1h23m15s
I walked 1.0km in 9m24s
Realign streets. They now have much less wide corners into each other.
Updated a fast_food
I walked 9.1km in 1h35m41s
I hiked 4.7km in 3h24m10s
I walked 6.7km in 1h12m03s
I walked 7.7km in 1h47m24s
Updated a pub
Updated a pub
Created a bar; Updated a bar; Confirmed a restaurant and a bar

Shortlink
This article has a short URL available: https://drck.me/pcre-jit-epa