
PHP's segmentation faults GDB-fu
Sometimes PHP segfaults (crashes) in a production environment, where Xdebug is often not available (and shouldn't be either of course). In those cases trying to figure out where in your code PHP crashes can be hard to find out. In some cases it's a real bug in PHP, where you would need some more intricate knowledge of PHP's internals — in many cases it's rather a coding error that provides you with infinite recursion.
Trying to figure out the functions that were called in a loop is not trivial if you do not possess GDB- and PHP internals-fu. However, because we as PHP developers are lazy, provide a few GDB tricks to make this easier. First of all, it's only really going to work if you haven't stripped the symbols from your PHP and Apache binaries. Secondly, you still need to have the PHP source lying around somewhere — preferably from where you've built PHP. After you're in GDB (either by opening an already existing core dump, or when the process aborts after starting it from GDB) you can "source" the macros that make your life easier. Basically you have to run this on the GDB prompt:
(gdb) source ~/dev/php/php-5.2dev/.gdbinit
If you then run the following on the GDB prompt, you get a nice stack trace — but without variable information that you're used to from seeing Xdebug traces.
(gdb) zbacktrace
The start of the output looks like:
[0xd03bb330] a() /tmp/recur.php:5
[0xd03bb530] d() /tmp/recur.php:4
[0xd03bb730] c() /tmp/recur.php:3
[0xd03bb930] b() /tmp/recur.php:2
...
In PHP 5.3 and higher, PHP will not segfault when you do infinite recursion as the engine has been changed. Instead, PHP would simply run out of memory and show an error not unlike:
Fatal error: Allowed memory size of 134217728 bytes exhausted at /home/derick/dev/php/php-5.3dev/Zend/zend_execute.h:157 (tried to allocate 523800 bytes) in /tmp/recur.php on line 2
Update: Instead of "dump_bt executor_globals.current_execute_data" you can simply run "zbacktrace".


Life Line
Updated a restaurant
Created a bench
Updated a cafe
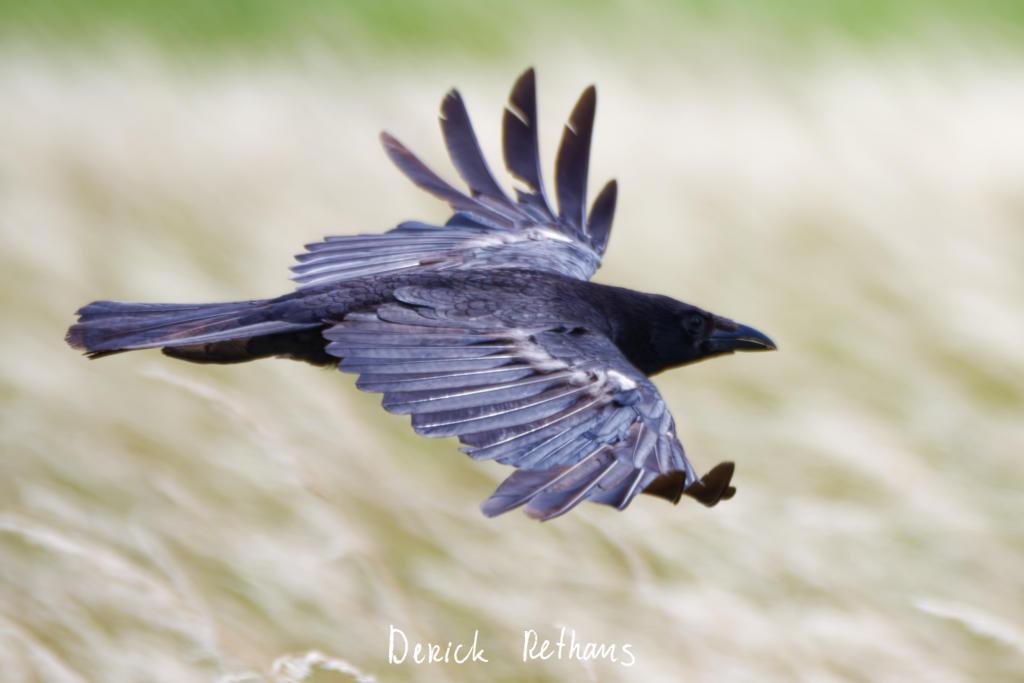
But I think my favourite photo was of this Carrion Crow in flight.
#Photography #BirdsOfFediverse #BirdPhotography #Nature
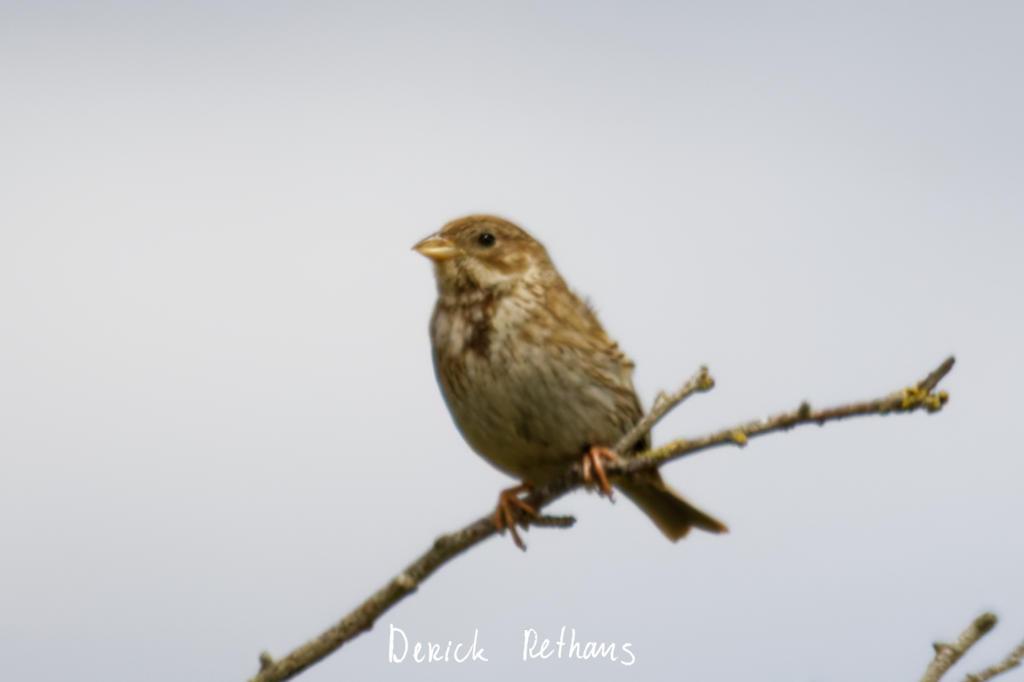
The new birds I saw, were mostly too far away to get good photos.
But I saw my first Spoonbill, Corn Bunting, and a flock of Black-tailed Godwits.
#BirdPhotography #BirdsOfFediverse
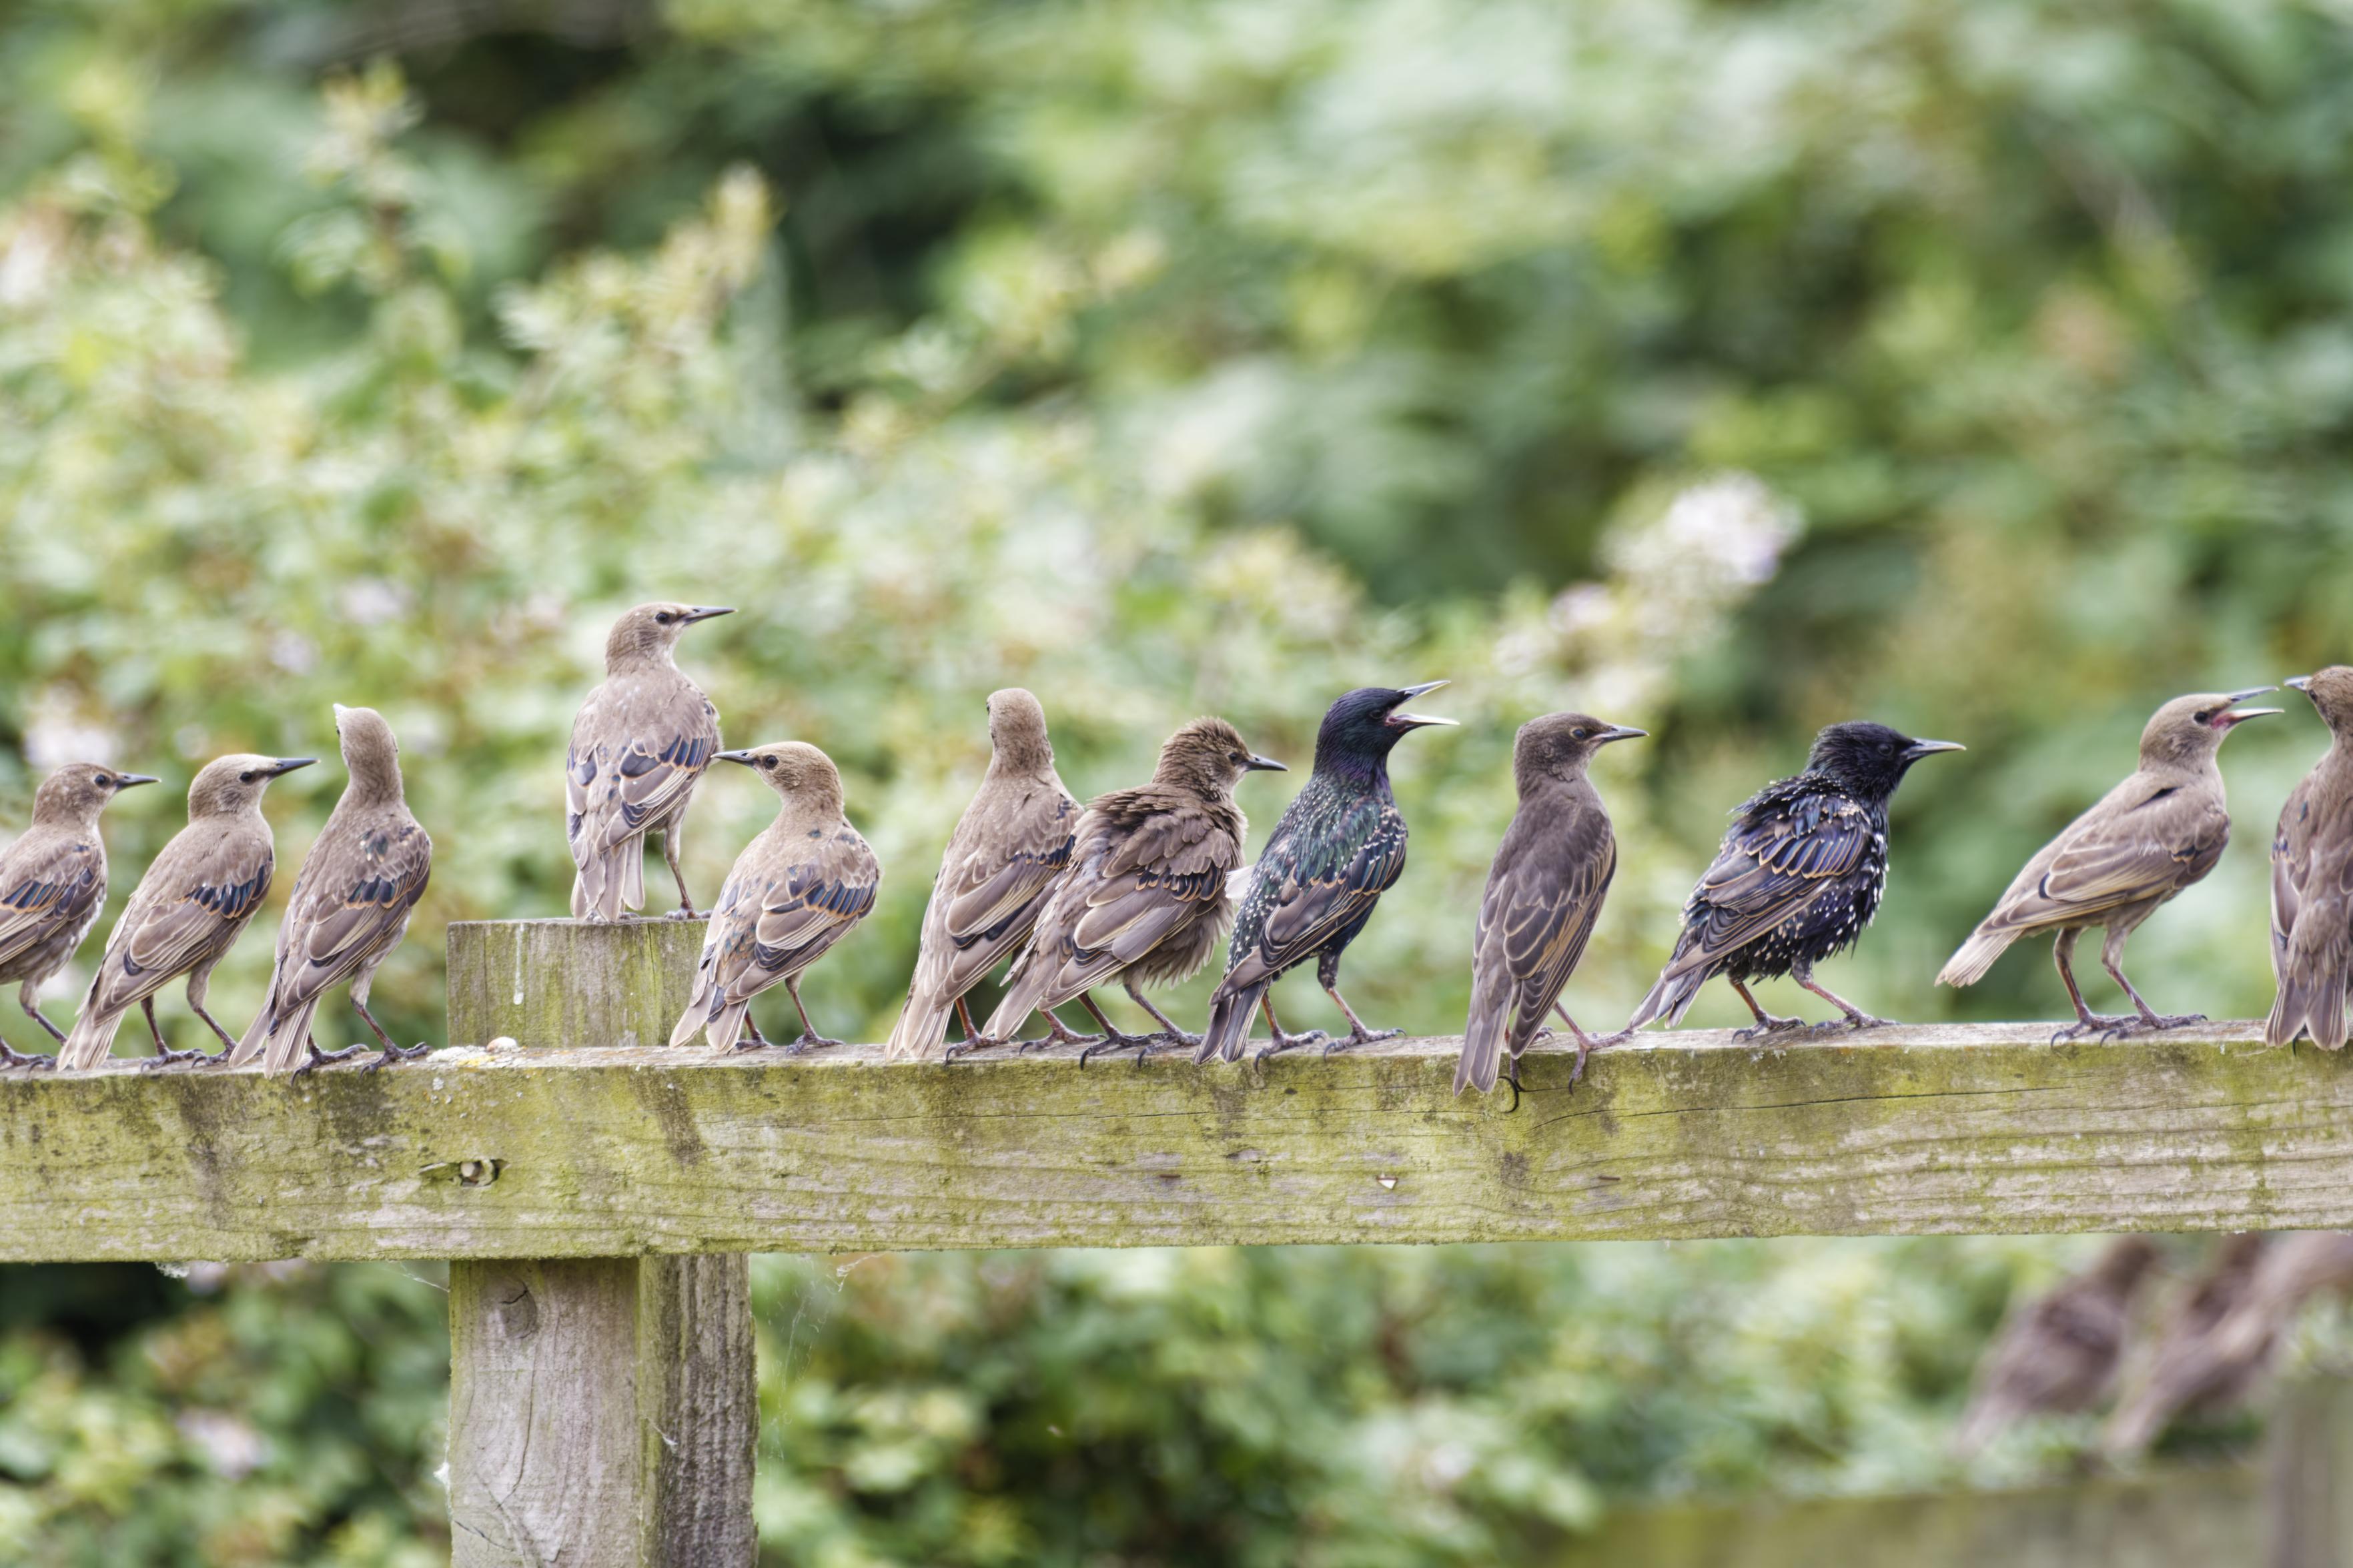
I had a lovely walk around RSPB Bowers Marsh yesterday, where I saw some expected birds, and a bunch of new species.
When I got there, there was this welcome committee of Starlings.
#BirdPhotography #nature #BirdsOfFediverse #Birds #Photography #RSPB
RSPB Bowers Marsh
Created 2 benches
I hiked 11.3km in 3h31m08s
Updated a pub
Updated a pub
Updated 4 pubs; Confirmed a pub
Created a restaurant
I walked 0.8km in 9m31s
I walked 2.1km in 16m42s
I walked 4.7km in 48m42s
I walked 7.4km in 1h16m10s
Updated a fast_food
Updated a cafe, a pet shop, and a bench; Confirmed a cafe, a convenience shop, and a motorcycle_repair shop
I walked 5.0km in 1h2m27s
I walked 1.1km in 10m08s
Updated a cafe; Confirmed 3 convenience shops, a fast_food, and a laundry shop
Created a fitness_centre; Updated an event_caterer office and a social_facility; Confirmed a restaurant and a pharmacy
I walked 7.6km in 1h29m58s
Updated a pub
Shortlink
This article has a short URL available: https://drck.me/psfg-6ho