
PHP and Ordnance Survey Mapping
About a month ago, Ordnance Survey opened up some of their data for public consumption under a brand called OpenData. The data is licenced under a "Creative Commons Attribute"-like license. One of the data sets they provide is Code-Point Open and provides a dataset "that contains postcode units, each of which have a precise geographical location". I've always been a bit of a map-geek, and have always geotagged my pictures and some of my tweets. So I was wondering what cool thing I could do with this newly released data. I decided to map all the postcodes onto the UK map where more postcodes for a specific place would create a "lighter" colour. Each postcode has on average about 15 addresses, so in more densely populated areas you have more "postcodes-per-area". Doing this wasn't very difficult and it resulted in the following map:

You can very clearly see the more densely populated areas such as London.
This generated postcode-density map I wanted to overlay on a real map, such as OpenStreetMap provides. When I tried to align the image that I generated with the OSM map, I ended up with this:

Obviously, the maps don't align. In order to fix this, I ended up learning a lot more about map projections.
The Code-Point Open data uses the UK's National Grid to store location data in. The National Grid consists of 100*100 km squares that are then further subdivided into smaller squares creating grid references such as TQ3012780512, or the numerical version 530128 180512. TQ translates into the "hundred thousands" of the Eastings and Northings according to the grid that you can see here. In this case, it specifies a point 530 128 meters East and 180 512 meters North of the origin. (If you work it out, you'll end up in London).
OpenStreetMap uses a Mercator projection to visualize maps. The Mercator projection is a cylindrical map projection, and it distorts the size and shape of large objects, as the scale increases from the Equator to the poles. Therefore it only works from about 85°N to 85°S (why it is 85° only be came clear after doing all the maths for it). Google Maps uses the same projection.
There were a few challenges plotting the Code-Point Open data on an OpenStreetMap map:
-
The National Grid coordinates need to be converted to Latitude/Longitude pairs
-
Latitude/Longitude pairs need to be mapped to pixels to align with the Mercator projection of OpenStreetMap maps.
For converting National Grid references to Latitude/Longitude pairs I found some JavaScript code. I converted this code to PHP and to verify whether my code was working properly, I used this site.
Converting Latitude/Longitude pairs to the pixel coordinates of OSM required a bit of maths. OSM provides maps in different zoom levels, from 2 to 17. Each zoom level having twice the amount of pixels horizontally and vertically. Zoom level 2 has 4 times 4 tiles, where each tile is 256*256 pixels. At zoom level two, the whole world fits into 1024*1024 pixels. The number of pixels for each axis for a specific zoom-level can be calculated by:
pow(2^zoom) * 256
For a zoom level of 7 that makes 16384 pixels in each direction. To convert a longitude (in the range -180° to 180°) we can simply apply:
x = ((lon + 180) / 360) * (pow(2^zoom) * 256)
For a Longitude of 0.003117° E at zoom-level 13 that turns out to be pixel 1048594.
Longitude conversions are more difficult due to the Mercator projection itself. To convert we apply:
y = ((atanh(sin(deg2rad(-lat))) / π) + 1) * (pow(2^(zoom-1)))
For a Latitude of 51.502817° N at zoom-level 13 that turns out to be pixel 697399.
Creating an image for the whole world at zoom level 13 is impractical as it is 2097152*2097152 pixels and downloading all the 67 million tiles for this zoom level is probably not liked by the OSM people either. So instead we take a cut out for a specific area only. For the UK (61.37°N -9.49° W, 49.76°N +3.63°E) at zoom level 7 we end up with a 1536x2048 map with the North-Western pixel being 15360,9216. On this map, we can draw the latitudes and longitudes as well as the National Grid lines (full image is on flickr):

The only thing left to do now, is to map the postcode density information to the map. I picked zoom level 6 for this, and the result is (after cropping it to 640 pixels width):

As you can see, this is perfect fit to the outlines of the country. But unfortunately, when we look very closely at the plotted map data, for example for the NW10 3 postcodes, we notice that the mapping is slightly off. The blue dots are what we plotted, and the red dots are what the locations should have been:

The reason for this is that when we converted the National Grid locations to Latitude/Longitude pairs to plot on the OSM maps, I forgot to take into account the different Datums that are used in the projections. The Earth is not a perfect sphere, and an approximation of the ellipsoid of the whole Earth is not necessarily the best fitting for a specific area such as the UK. Therefore, the National Grid uses the OSGB36 Datum which fits more closely to the UK, where as OpenStreetMap uses the WGS84 Datum that is also used by GPS. The Ordnance Survey Ireland has a more thorough explanation on their site. As you can see above, using the wrong Datum can mean locations can be off. In our example about 100 meters. Converting between different Datums is possible, albeit processor intensive.
After I figured out all the maths for this, the only problem that remains that implementing those algorithms in PHP is show—calculating all the positions from the 1.6 million postcode locations takes up to 10 minutes. This is why I am not presenting any code yet. I am planning to implement all the necessary calculations in a PHP extension to speed up the calculations

Comments
I did read about the Ordance Survey going open on the BBC News a while back but at the time was some time off and forgot all about it until now - thanks to you :)
All we need now is a web service and the means to cache the data and we're off to a flying start (once more) :D
Jonathan Stott has done some sterling work in PHP for converting from OSRef to Lat/Lngs (and vise-versa) with datums and has produced a very useful class that wraps it all up
Funny, I used to live in a house located on that last map.
Anyway, does the license allow for converting to lat/long and re-publishing?
I'm guessing not.
@Richard: That code is unfortunately GPL. I've similar code, slightly more extensive that I will put in an extension for optimum performance.
@Kelvin: Interesting, I live in a house on that map right now ;-)
I don't see why you couldn't republish it with lat/lon... check the license if you want to be sure :-)
The geek capital of NW10? Silicon Gardens? tee hee.
Interestingly, the license seems to expressly permit adapting and publishing… so why not?
Hmm might try and knock something together.
There's a web service for postcode lookup here (lat/lon and Easting/Northing) http://www.uk-postcodes.com/postcode/E97NE
Postcodes by lat/lon available here http://parlvid.mysociety.org:81/os/ http://parlvid.mysociety.org:81/os/codepo_gb_wgs84.zip
All based on the OS release and re-released under the terms of the OS OpenData licence
I found this most interesting. If we assume that GPS will become more popular is there a case for a printed map projection based on Longitude and Latitude so people could use GPS co-ordinates on a paper map? ie rather like the established grid reference. The problem I guess is the "real" location will change over time against the Co-ordinate.

Life Line
Created a vending_machine
Updated a bus_stop
Updated a confectionery shop, a massage shop, and 2 other objects; Deleted a books shop
I hiked 7.0km in 4h21m00s
Updated a deli shop and a pet_grooming shop
I walked 4.2km in 49m42s
I walked 1.4km in 10m14s
I walked 2.2km in 1h43m13s
I walked 4.4km in 1h25m00s
Updated a cafe
Updated a bar
I walked 1.7km in 19m07s
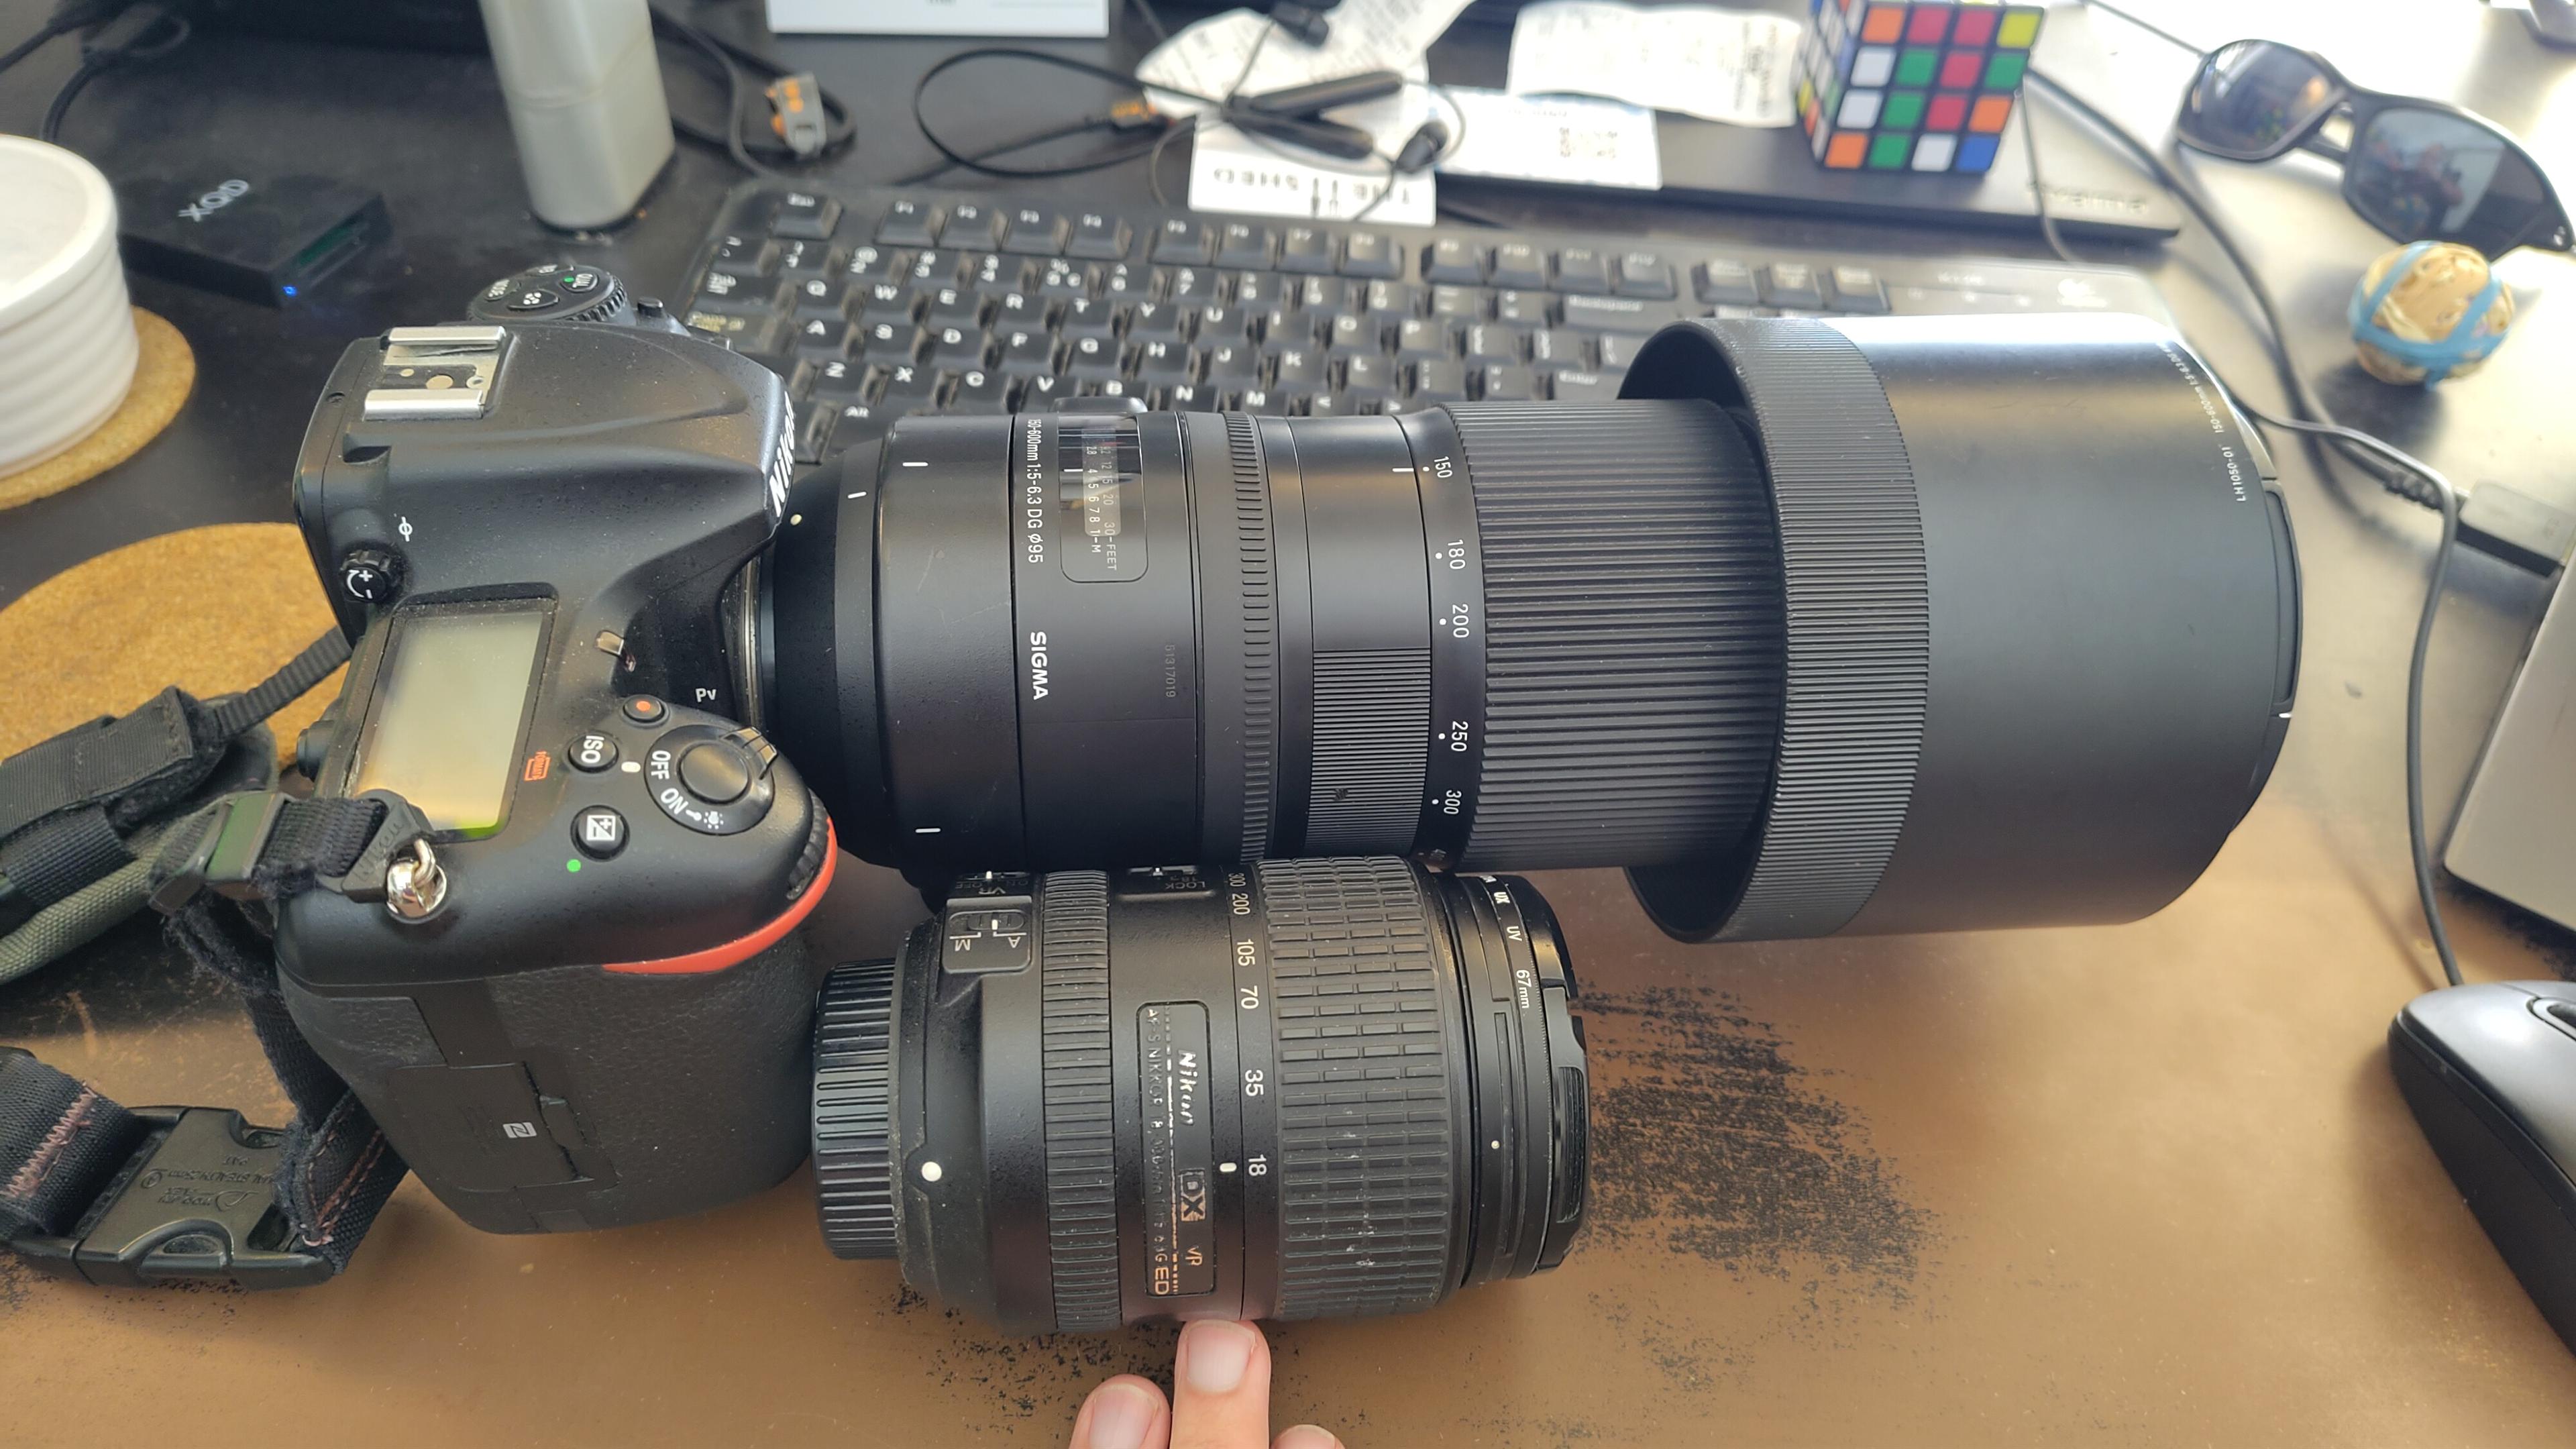
I got a new lens. It's a little bit larger, and loads heavier, than my older one.
#photography #naturephotography
I walked 1.6km in 15m10s
Updated a pub
I walked 4.5km in 41m34s
Merge branch 'v2022'
Merge branch 'isspace-fixes' into v2022
Cast to 'unsigned char' for all ctype style functions (isspace, toupp…
I saw a Kingfisher fishing yesterday!
It's not a great photo, but it was great seeing it using the branch as a perch for fishing.
#BirdPhotography #BirdsOfFediverse #Nature #London

Does anybody have good/bad experiences with "mpb.com" for used camera gear/lenses in the UK?
Created 9 benches and 9 picnic_tables; Updated 3 benches
I hiked 10.5km in 4h26m04s
Updated a restaurant

Shortlink
This article has a short URL available: https://drck.me/php-aosm-7uk