
South Kensington Mapping Party Animation
Every two weeks or-so, the London OpenStreetMap group comes together for a mapping party. The main idea is to go to an area of London to improve the map there. Sometimes that's adding streets, but as most of those are now completed, time is spend on buildings, address information and points-of-interest.
As an experiment I recorded a snapshot of the map for the area (http://mapcraft.nanodesu.ru/pie/73) every hour to follow the progress of people adding new and improved data to the map. I then rendered an image of each map snapshot and put those together to create a video:
You can see the video in HD on Vimeo.
How Did He Do That?
Well, first of all, I already have a script to keep a local version of the London XML map data (as london.osm) up to date. Each hour, this script:
-
Read the old
london.osmfile and merge in changes through the OpenStreetMap replication service and write it aslondon-new.osm. -
Compare the old file and the new file and write out a changes file to
changes/diff-<timestamp>.osc. This is not needed for this to work, but I am interested in this information as well. -
Move the new file to the old file.
-
Import it into my local PostGreSQL/PostGIS instance.
In script form, that looks like:
#!/bin/bash

NOW=`date +%Y%m%d-%H%M`

export JAVACMD_OPTIONS="$JAVACMD_OPTIONS -Djava.net.preferIPv4Stack=true"
../osmosis-0.39/bin/osmosis --rri --simc --rx london.osm --ac --bb left=-0.563 right=0.28 top=51.68 bottom=51.26 --wx london-new.osm
../osmosis-0.39/bin/osmosis --rx london-new.osm --rx london.osm --derive-change --write-xml-change file="changes/diff-$NOW.osc"
mv london-new.osm london.osm
../try4/bin/osm2pgsql/osm2pgsql -S ../try4/bin/osm2pgsql/default.style --slim -d gis -C 2400 london.osm #-e 15 -o expiry.log
And from that I then can render maps of London quite easily:
cd /backup/osm/try4/bin/mapnik
./generate_tiles_london.py | grep -v " exists"
In order to make a snapshot of South Kensington, or at least, the area that we were going to map in, I added another task. I placed it just after the moving of the old file to the new file. This task cuts out the South Kensington area and puts it in a file south-ken/south-kensington-<timestamp>.osm:
../osmosis-0.39/bin/osmosis --rx london.osm --bb left=-0.18256 right=-0.16853 top=51.49426 bottom=51.48733 --wx south-ken/south-kensington-$NOW.osm
This generated about 100 files in the south-ken directory, where each XML file contained a snapshot of the map on each specific hour.
I then ran the following script to create a image of each of those map files:
#!/bin/bash

export MAPNIK_MAP_FILE=/backup/osm/try4/bin/mapnik/osm.xml
mkdir -p images
LAT1=-0.18256
LON1=51.48833
LAT2=-0.16853
LON2=51.49326

for i in south*osm; do
  /backup/osm/try4/bin/osm2pgsql/osm2pgsql -S /backup/osm/try4/bin/osm2pgsql/default.style --slim -d gis -C 2400 $i
  /backup/osm/try4/bin/mapnik/generate_image.py ${LAT1} ${LON1} ${LAT2} ${LON2}

  mv image.png images/${i}-0.png
  LAT1=`echo "${LAT1} + 0.000005" | bc -q`
  LON1=`echo "${LON1} + 0.00001" | bc -q`
  LAT2=`echo "${LAT2} - 0.00001" | bc -q`
  LON2=`echo "${LON2} - 0" | bc -q`

  /backup/osm/try4/bin/mapnik/generate_image.py ${LAT1} ${LON1} ${LAT2} ${LON2}
  mv image.png images/${i}-1.png
  LAT1=`echo "${LAT1} + 0.000005" | bc -q`
  LON1=`echo "${LON1} + 0.00001" | bc -q`
  LAT2=`echo "${LAT2} - 0.00001" | bc -q`
  LON2=`echo "${LON2} - 0" | bc -q`
done
I had to modify the generate_image.py script from the Mapnik distribution slightly to allow the bounding box to be passed in through the command line. I also set the image width and height to 1280 by 720:
...
ll = [];
for arg in sys.argv:
    ll.append(arg)
ll.pop(0);
for index, arg in enumerate(ll):
    ll[index] = float(arg)

z = 15
imgx = 1280
imgy = 720

m = mapnik.Map(imgx,imgy)
...
Once all the PNG files were created, I converted them to the JPEG format and ran mencoder to generate the AVI film:
for i in *png; do convert -quality 100 $i $i.jpg; done
mencoder "mf://*.jpg" -mf fps=10 -o test.avi -ovc lavc -lavcopts vcodec=msmpeg4v2:vbitrate=7200
And this video I then uploaded to Vimeo. Voilà! One OpenStreetMap mapping party progress animation!

Comments
That's cool! We need more videos like that as they can attract new contributors.
A month ago I discussed with Osmisto (a guy working on mapcraft) the idea of adding new frames to animations when someone changes the state of theirs slices on mapcraft or adds a link to a new changeset in comments. Thus you can get more different frames and the video will be more interesting to watch. Hope they find time to do this one day.
Additionally, it's possible to add some kind of api to make animation rendering easier for external renderers as your. You simply would have to do something like
wget http://mapcraft.nanodesu.ru/pie/73/state_hash
once a minute and if the result you receive is different, grab new data and render it, or just glue refreshed mapnik tiles and get a new frame.
Have you seen this project?
https://github.com/synewaves/geo_helper
Seems like it could possibly be useful in your mapping endeavors.

Life Line
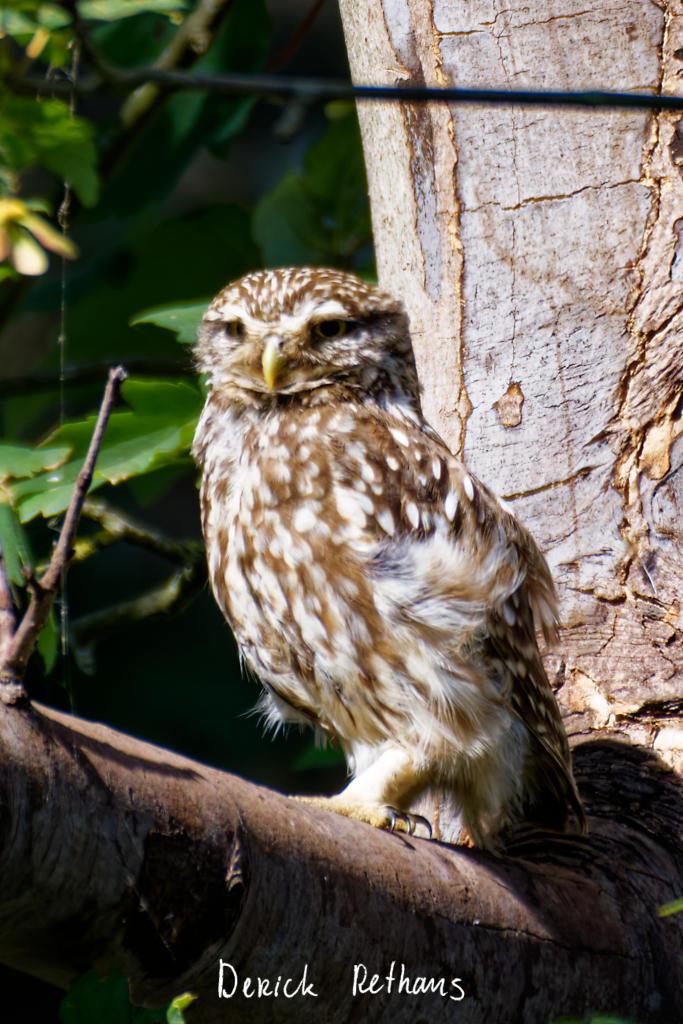
Little Owl owlet
This lovely owlet was quite easy to find in a London Park, with some help as they camouflage so well!
I saw its sibling too.
#BirdPhotography #BirdsOfFediverse #Photography #Nature #London #BirdsOfMastodon
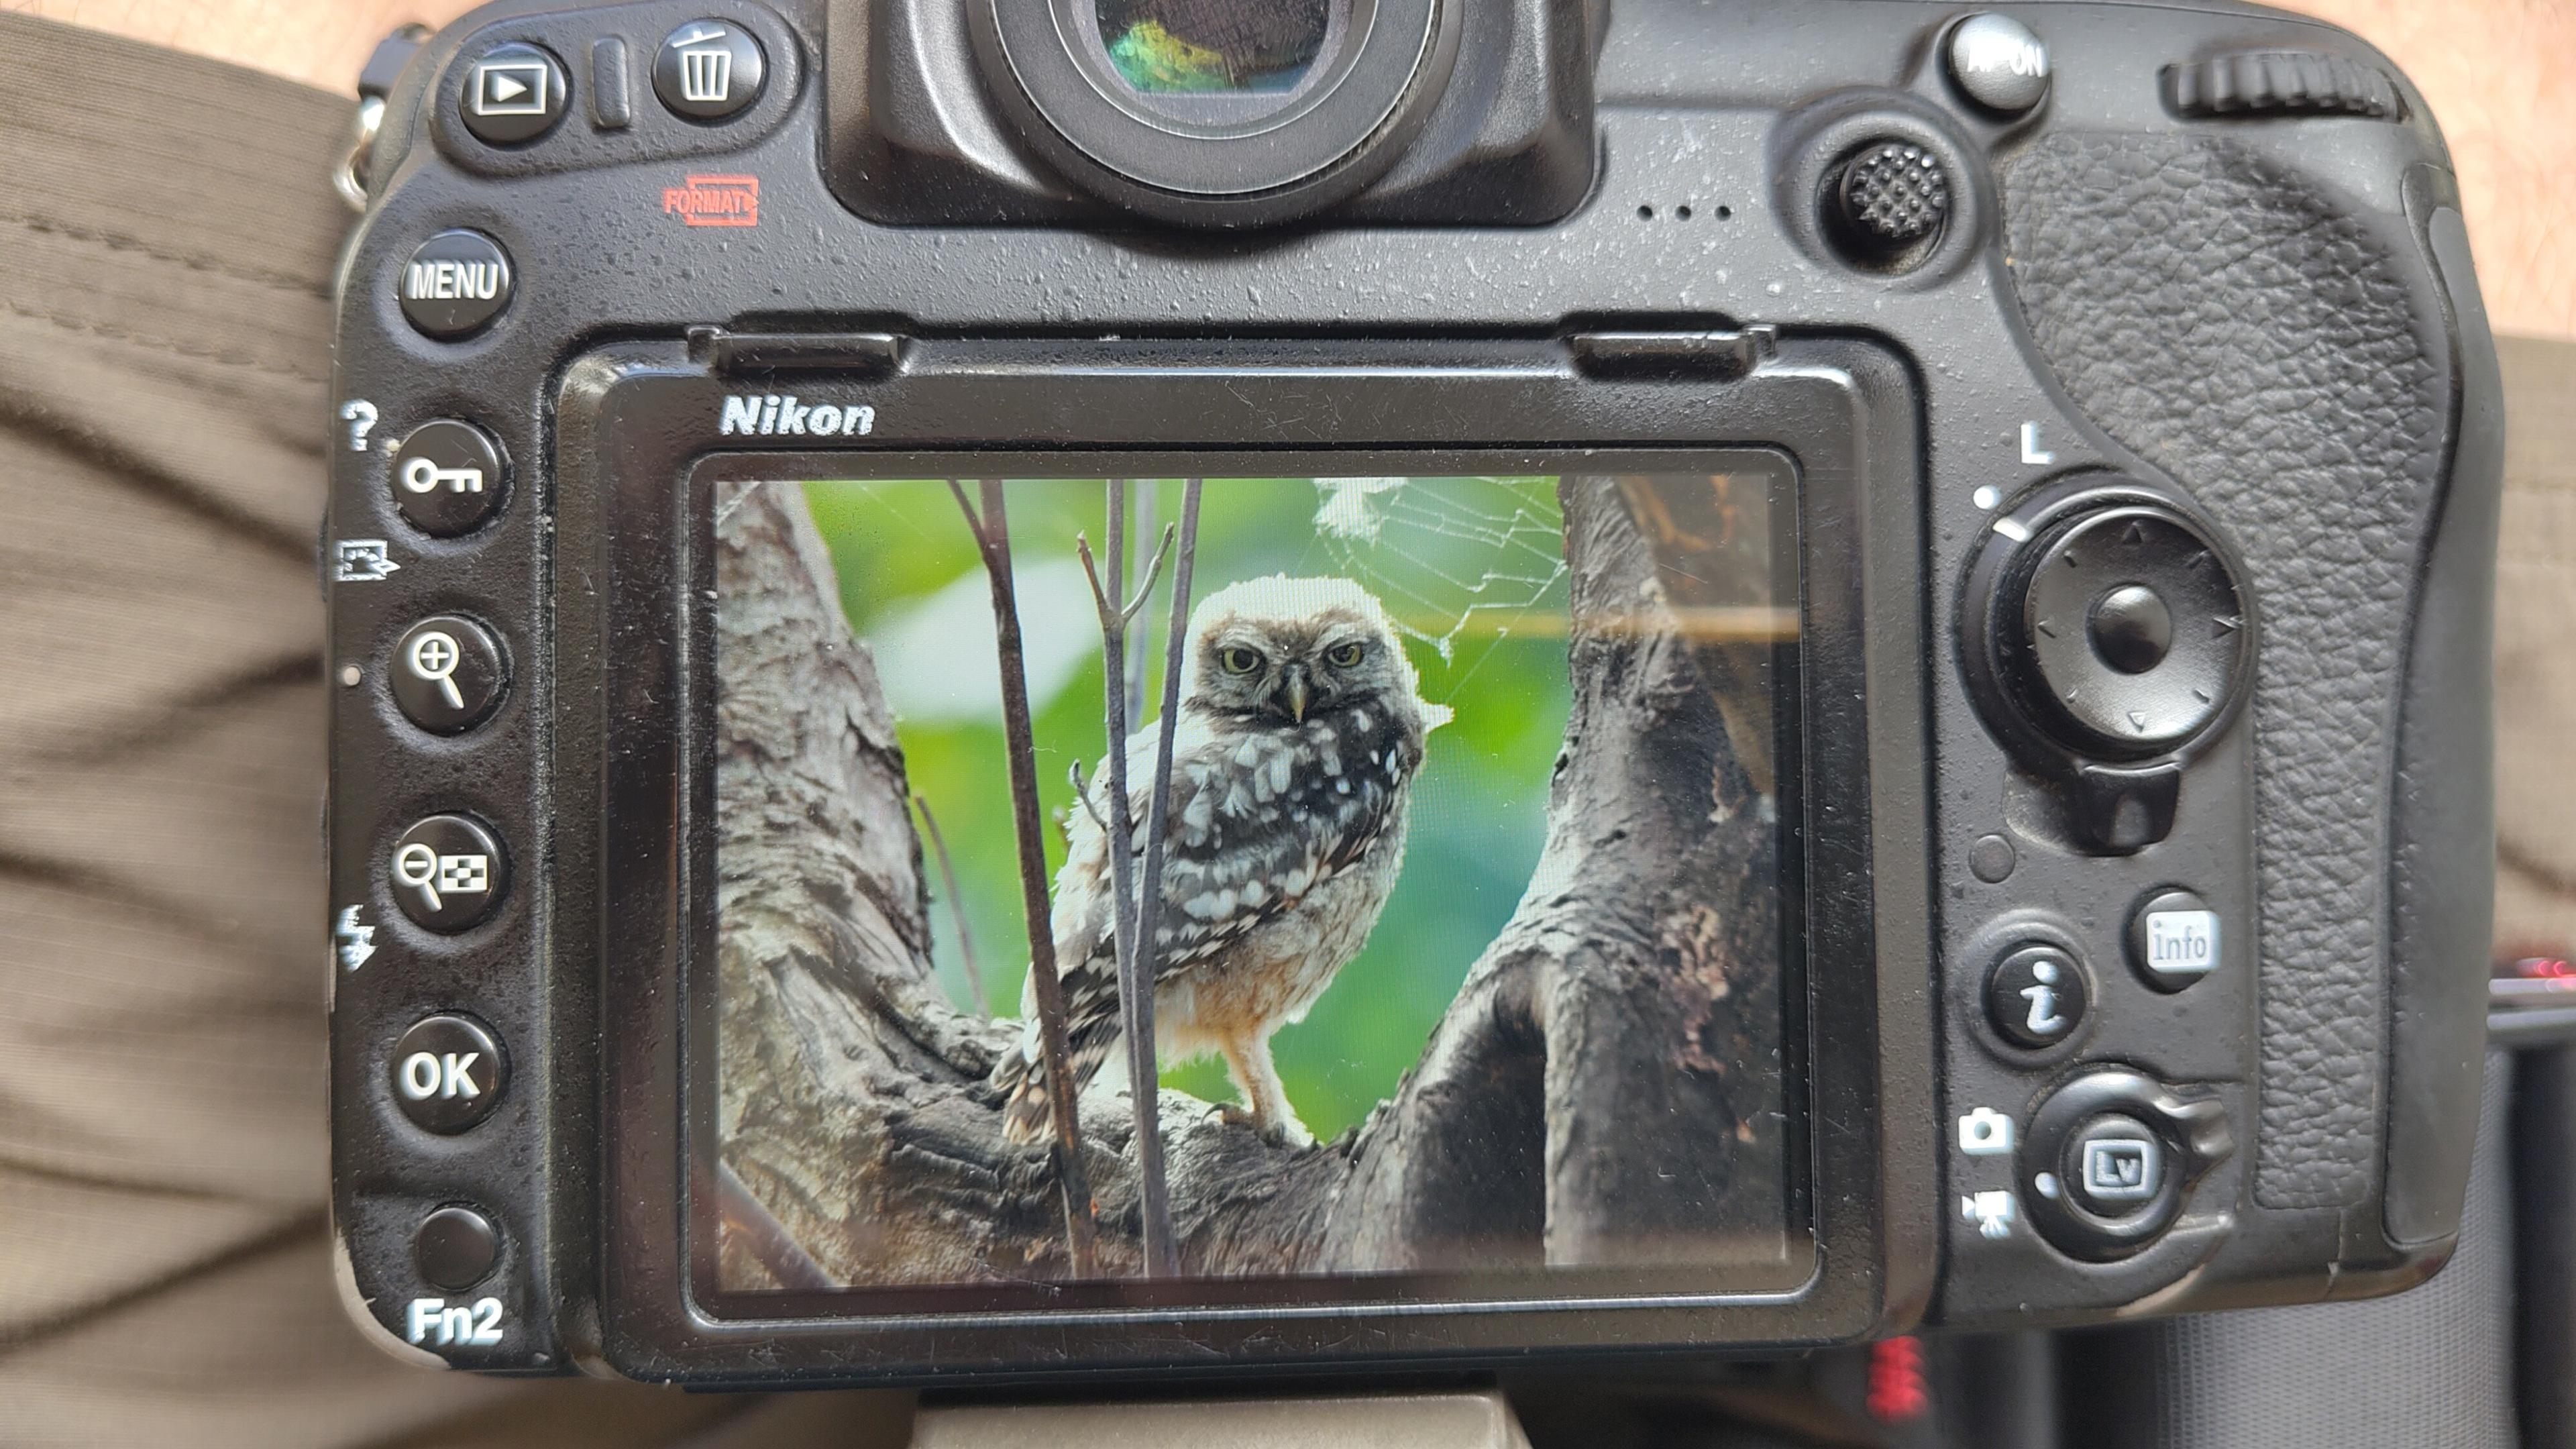
I went to a park (Bushy Park) to look for some owls.
I found Owls (Little and Tawny), but also a Green Woodpecker and two Kingfishers.
Snaps from my camera screen, and real photos will follow, but not of the Kingfishers as they were too far away and the photos are blurry.
#london #BirdPhotogaphy #BirdsOfMastodon #Birds #photography #BirdsOfFediverse #BushyPark
I hiked 13.8km in 4h44m12s
Created a chocolate shop and a restaurant; Updated 6 restaurants and an address; Confirmed 5 restaurants, a community_centre, and 3 other objects
Created a restaurant, a fast_food, and 2 other objects; Deleted a restaurant
I walked 8.5km in 1h31m45s
Created 2 buildings and a hairdresser shop; Updated a restaurant and an estate_agent office; Confirmed a cafe
I walked 2.2km in 38m09s
Merged pull request #1096
Bump actions/checkout from 6 to 7
Merged pull request #1095
Improve Tiverton Green mapping
Created 2 gates
I walked 7.1km in 1h23m15s
I walked 1.0km in 9m24s
Realign streets. They now have much less wide corners into each other.
Updated a fast_food
I walked 9.1km in 1h35m41s
I hiked 4.7km in 3h24m10s
I walked 6.7km in 1h12m03s
I walked 7.7km in 1h47m24s
Updated a pub
Updated a pub
Created a bar; Updated a bar; Confirmed a restaurant and a bar

Shortlink
This article has a short URL available: https://drck.me/sken-vid-8po