
Flamboyant Flamegraphs
In this article, I am showing you how to make a flamegraph, a new feature in Xdebug 3.3.
Flamegraphs are an interesting way of showing where an application spends a lot of time.
To show you the functionality, I will be using Xdebug's own website, which I run locally at port 9874.
First of all, we need to configure Xdebug to make our flamegraphs. We do that in a configuration file. With php --ini I find out which file to use:
Configuration File (php.ini) Path: /usr/local/php/8.2dev/lib
Loaded Configuration File:         /usr/local/php/8.2dev/lib/php.ini
Scan for additional .ini files in: /usr/local/php/8.2dev/lib/conf.d
Additional .ini files parsed:      /usr/local/php/8.2dev/lib/conf.d/20-mongodb.ini,
/usr/local/php/8.2dev/lib/conf.d/zzz-xdebug.ini
If you are running Apache or Nginx, I would suggest you use phpinfo() output in the browser to find the same information instead.
I have a specific Xdebug INI file called zzz-xdebug.ini. Its contents are currently:
zend_extension=xdebug.so
xdebug.mode=develop,debug
Flamegraphs are part of Xdebug's tracing functionality, which we need to enable by changing the xdebug.mode line to:
xdebug.mode=develop,debug,trace
The tracing functionality supports multiple formats. The flamegraph is number three, so we need to set that as well by adding:
xdebug.trace_format=3
By default, Xdebug Tracer will put files into the /tmp directory, and use a hash of the current working directory to create a trace file name. We want distinct flamegraphs for each URL, so we need to change that by setting:
xdebug.trace_output_name=xdebug.%R
We start all files with trace., and then we use %R to configure to use the URI. Xdebug also supports many other formatting specifiers.
By default, all file names will also be postfixed by .xt.gz.
After making INI changes, you need to restart the web server.
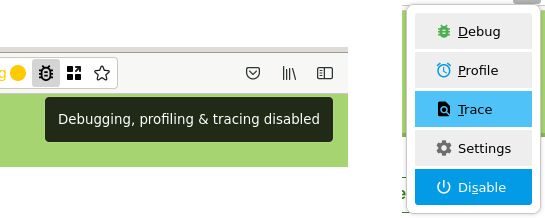
To initiate the tracer, I use an Xdebug Helper browser extension available for Chrome, Firefox, and other browsers.
I click on the debug icon and then on trace:
After requesting the home page, and documentation page, Xdebug's tracer created the following files in the /tmp directory:
derick@gargleblaster:~$ ls -l /tmp/trace.*
-rw-r--r-- 1 derick derick  123 Sep 26 03:31 /tmp/trace..05d7ef.xt.gz
-rw-r--r-- 1 derick derick 2560 Sep 25 16:55 /tmp/trace._core2_css.xt.gz
-rw-r--r-- 1 derick derick 3550 Sep 25 16:55 /tmp/trace._docs_.xt.gz
-rw-r--r-- 1 derick derick 2419 Sep 25 16:55 /tmp/trace._fonts_IBMPlexSans-RegularItalic-Latin1_woff2.xt.gz
-rw-r--r-- 1 derick derick 2474 Sep 25 16:55 /tmp/trace._images_logos_11com7_svg.xt.gz
-rw-r--r-- 1 derick derick 2507 Sep 25 16:55 /tmp/trace._images_logos_io_svg.xt.gz
-rw-r--r-- 1 derick derick 2530 Sep 25 16:55 /tmp/trace._images_logos_private-packagist_svg.xt.gz
-rw-r--r-- 1 derick derick 2455 Sep 25 16:55 /tmp/trace._images_logos_typo3_svg.xt.gz
-rw-r--r-- 1 derick derick 2523 Sep 25 16:55 /tmp/trace._images_logos_xdebug-cloud_svg.xt.gz
-rw-r--r-- 1 derick derick 6165 Sep 25 16:55 /tmp/trace._.xt.gz
Because we go through our PHP router process, there are also files for images and fonts.
The important ones are:
-rw-r--r-- 1 derick derick 3550 Sep 25 16:55 /tmp/trace._docs_.xt.gz
-rw-r--r-- 1 derick derick 6165 Sep 25 16:55 /tmp/trace._.xt.gz
The contents of these files look like:
{main};require_once;require_once 3046
{main};require_once;ComposerAutoloaderInit7d176ec022516f68e20dcb88554529a8::getLoader;require 7043
{main};require_once;ComposerAutoloaderInit7d176ec022516f68e20dcb88554529a8::getLoader;spl_autoload_register 9408
{main};require_once;ComposerAutoloaderInit7d176ec022516f68e20dcb88554529a8::getLoader;ComposerAutoloaderInit7d176ec022516f68e20dcb88554529a8::loadClassLoader;require 3176
{main};require_once;ComposerAutoloaderInit7d176ec022516f68e20dcb88554529a8::getLoader;ComposerAutoloaderInit7d176ec022516f68e20dcb88554529a8::loadClassLoader 41368
{main};require_once;ComposerAutoloaderInit7d176ec022516f68e20dcb88554529a8::getLoader;dirname 6061
…
In order to create a flame graph, we need to pass this through a Perl script. You can find this script by cloning the flamegraph GIT repository at https://github.com/brendangregg/FlameGraph
Xdebug automatically compresses trace files, which means we need to use zcat as the flamegraph.pl script tool does not understand that. The output needs to be redirected to a file. On one line, we enter:
zcat /tmp/trace._docs_.xt.gz
        | ~/dev/brendangreeg-FlameGraph/flamegraph.pl
        > /tmp/flame-docs.svg
You can now open this SVG file you can then open in a browser.
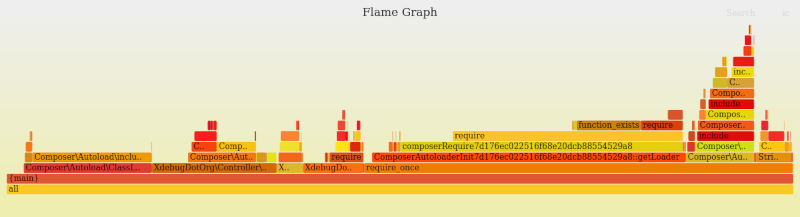
The stack shows how deep the code goes, and interestingly, for most of it, you'll see that a lot of time is taken up by Composer, as well as requiring other files.
You can dive in by clicking on specific bits. For example, I'll click on my template default controller:
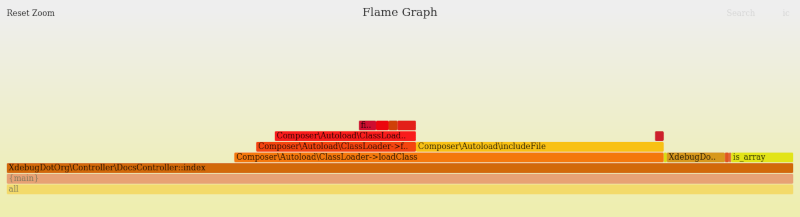
You can reset the zoom in the top left.
Xdebug's website is not very complex, and for your own code expect to see a lot more complicated flamegraph.
Once you're done, please don't forget to turn off the tracer, as it will fill up your hard drive.
This new flamegraph trace format is new in Xdebug 3.3, out soon.


Life Line
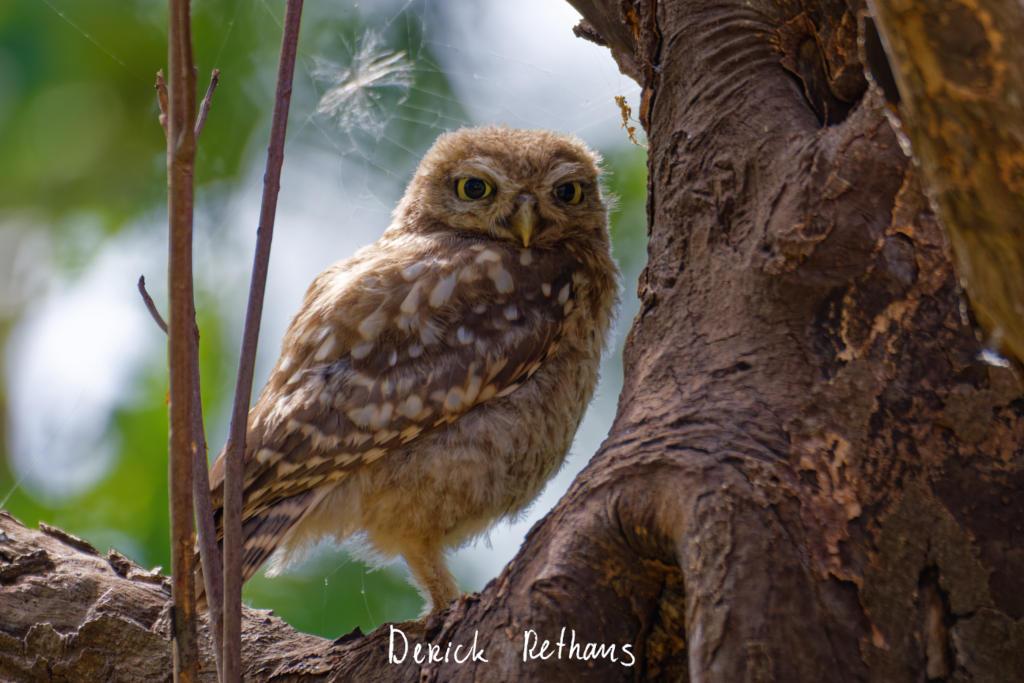
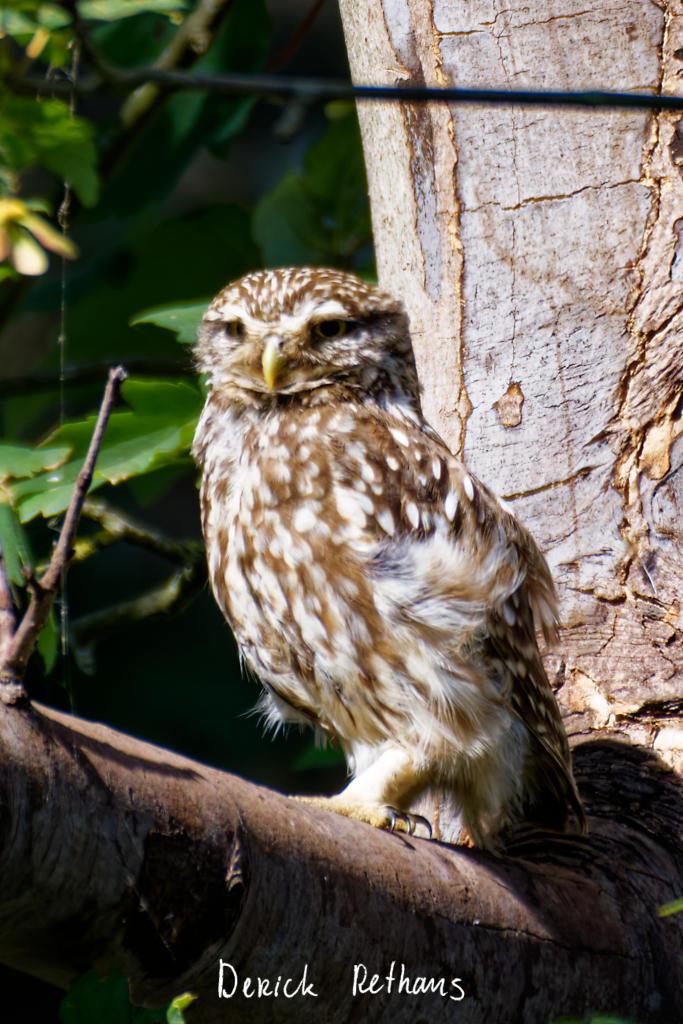
Staring Contest with an Owl
This Little Owl stared at me intensely for a fair amount of time in London's Bushy Park.
#BirdPhotography #BirdsOfFediverse #NaturePhotography #Photography #SuperbOwl #London #Birds
Updated an apartments building
Little Owl owlet
This lovely owlet was quite easy to find in a London Park, with some help as they camouflage so well!
I saw its sibling too.
#BirdPhotography #BirdsOfFediverse #Photography #Nature #London #BirdsOfMastodon
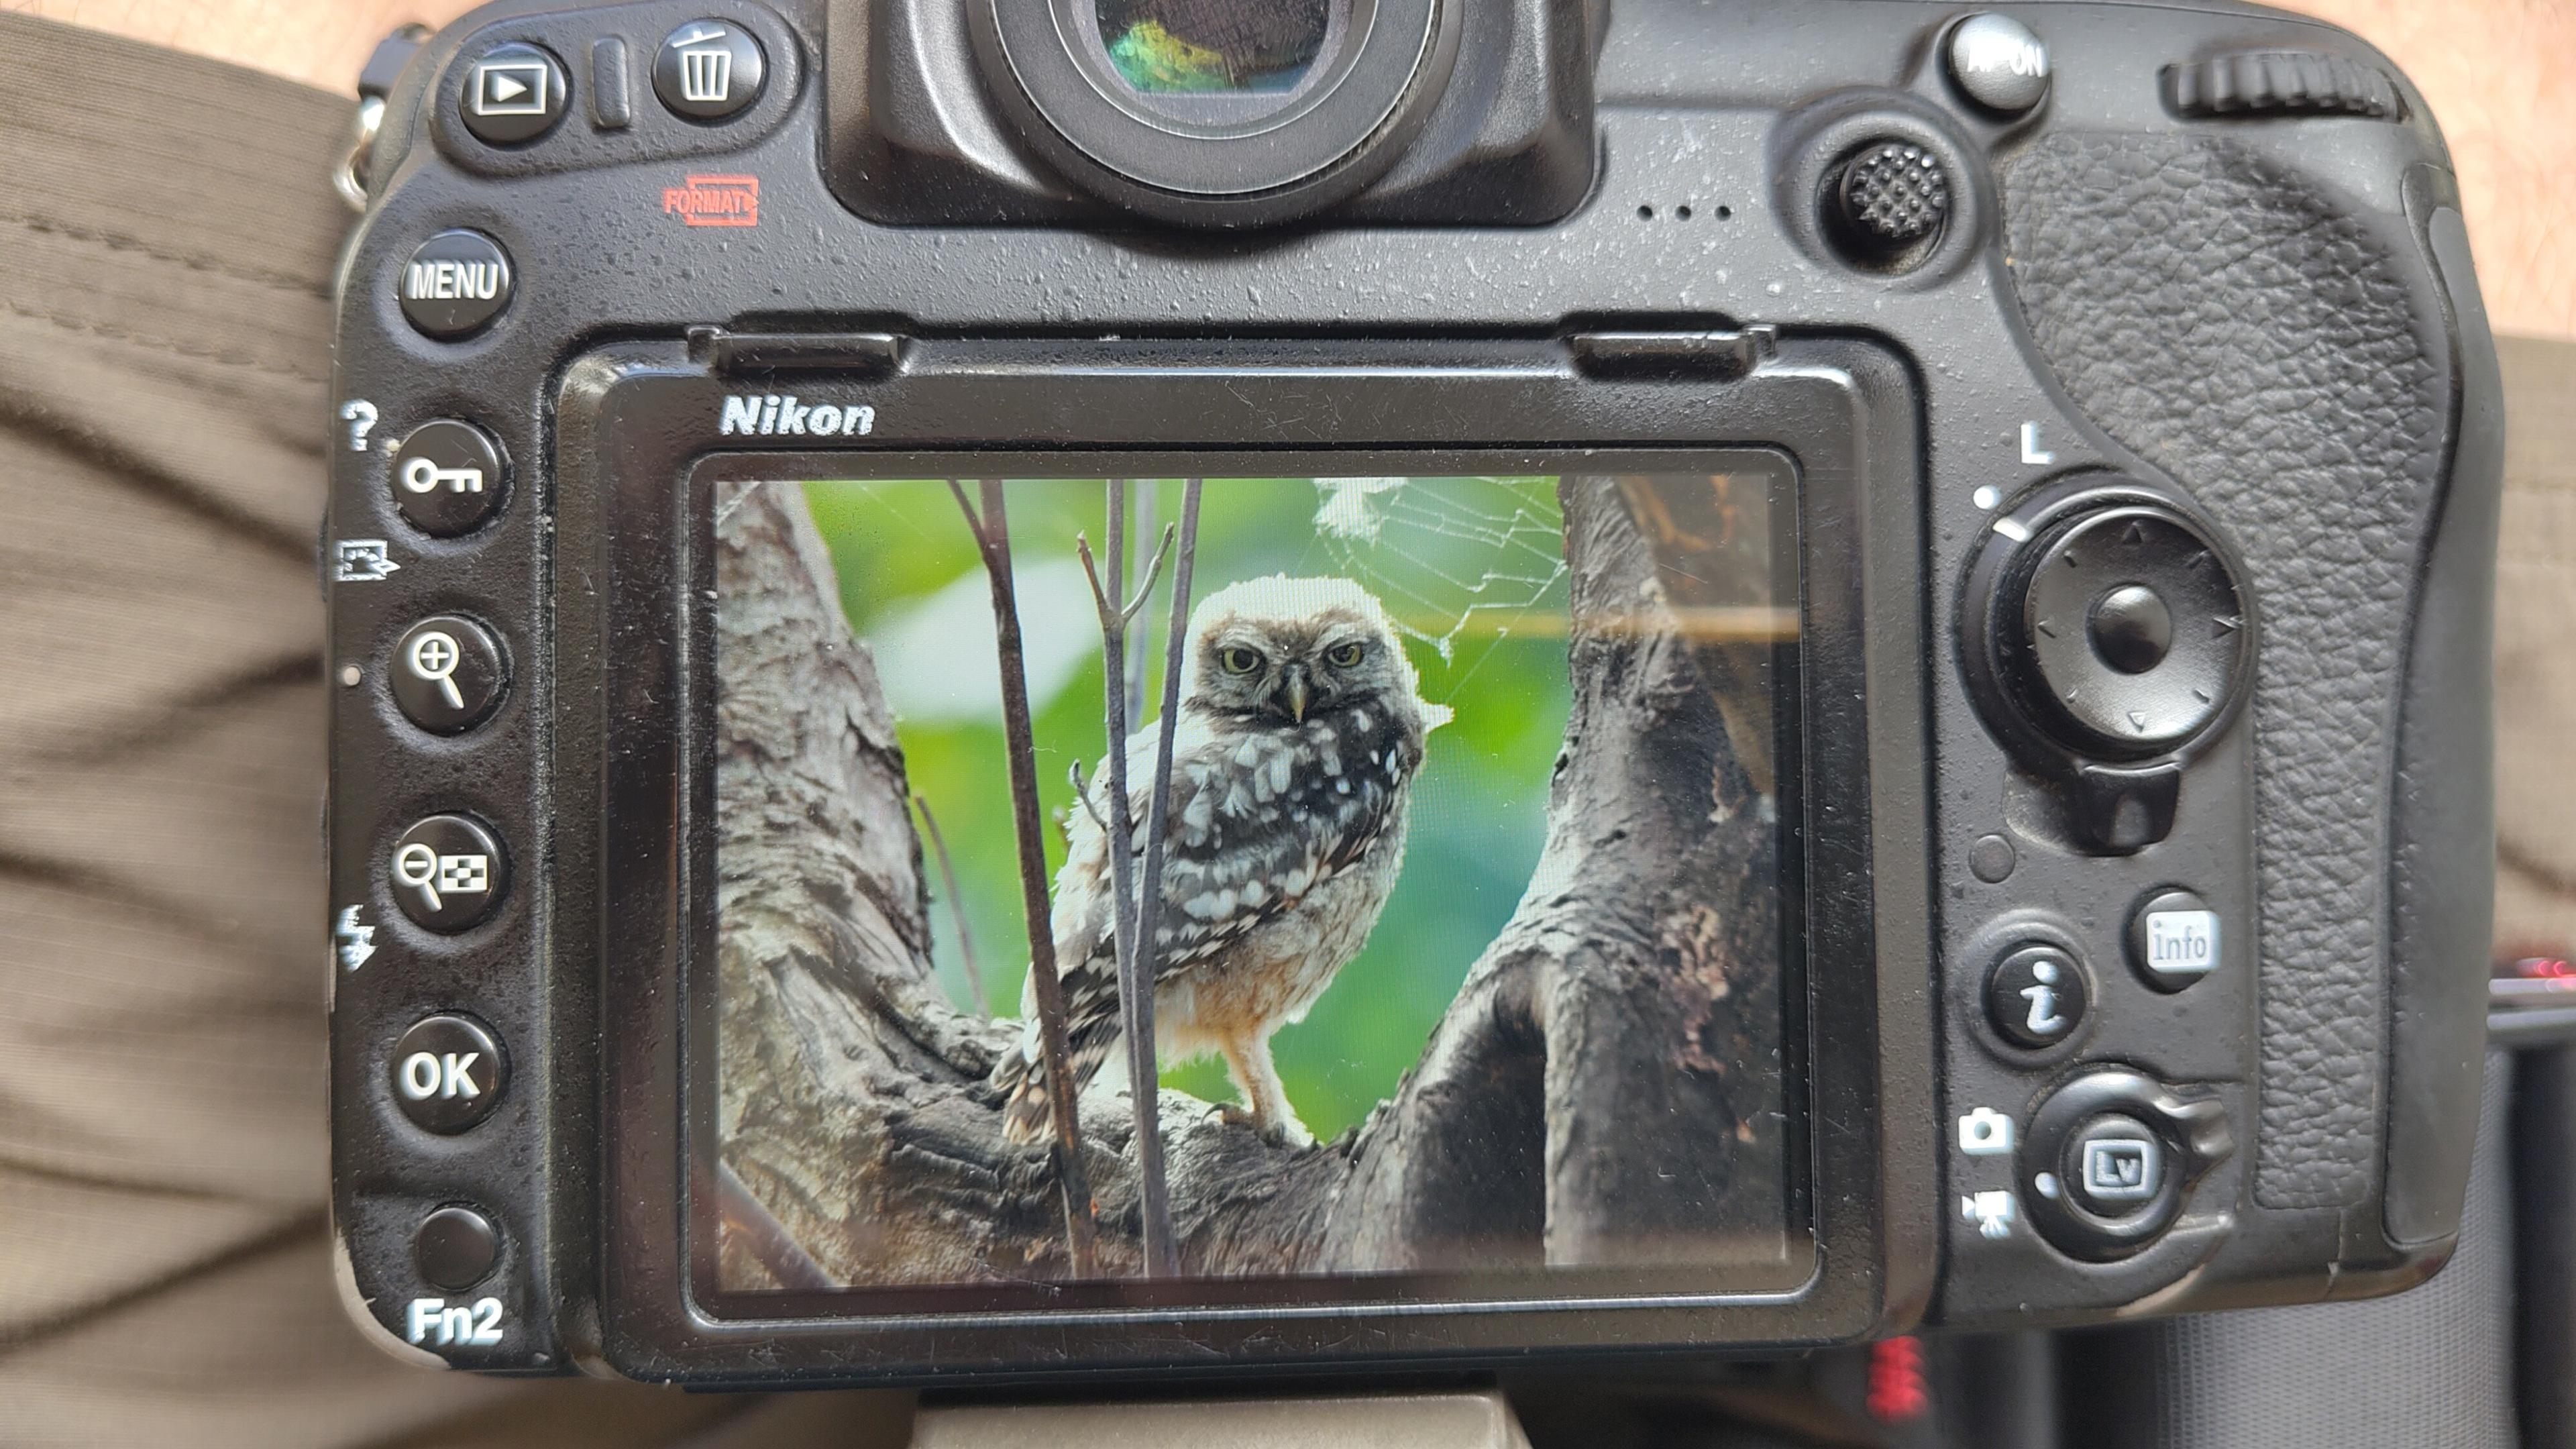
I went to a park (Bushy Park) to look for some owls.
I found Owls (Little and Tawny), but also a Green Woodpecker and two Kingfishers.
Snaps from my camera screen, and real photos will follow, but not of the Kingfishers as they were too far away and the photos are blurry.
#london #BirdPhotogaphy #BirdsOfMastodon #Birds #photography #BirdsOfFediverse #BushyPark
I hiked 13.8km in 4h44m12s
Created a chocolate shop and a restaurant; Updated 6 restaurants and an address; Confirmed 5 restaurants, a community_centre, and 3 other objects
Created a restaurant, a fast_food, and 2 other objects; Deleted a restaurant
I walked 8.5km in 1h31m45s
Created 2 buildings and a hairdresser shop; Updated a restaurant and an estate_agent office; Confirmed a cafe
I walked 2.2km in 38m09s
Merged pull request #1096
Bump actions/checkout from 6 to 7
Merged pull request #1095
Improve Tiverton Green mapping
Created 2 gates
I walked 7.1km in 1h23m15s
I walked 1.0km in 9m24s
Realign streets. They now have much less wide corners into each other.
Updated a fast_food
I walked 9.1km in 1h35m41s
I hiked 4.7km in 3h24m10s
I walked 6.7km in 1h12m03s
I walked 7.7km in 1h47m24s
Updated a pub

Shortlink
This article has a short URL available: https://drck.me/flgrph-i3g