
OpenStreetMap: A Year of Edits 2012
Just like last year I've analysed all the edits to OpenStreetMap and produced a visualisation. It was a bit trickier this year as I also wanted to visualize the work of the redaction bot as well as the "redaction period" and the switch to ODbL for OpenStreetMap data.
The result is: OpenStreetMap: A Year of Edits (2012):
This animation shows all additions and modifications of nodes (flashes) and cumulative edits (fading to purple) in 2012. Additional visualisations are the redaction bot's work (flying away yellow spheres) and the shift to ODbL (green flash). It gives a good overview of the effort that 1000s of contributors put in to make OpenStreetMap the best source of mapping data.
You can see the video in HD on Vimeo.
I have started to make the code for this available through GitHub, but the code is very much not modularized and it is likely it will only work on my set-up. Expect this to change for next year!
Mappy New Year!


Life Line
Created 2 waste_baskets; Updated 2 bus_stops and 2 crossings
I hate this timeline.
For @fridaynightdinners I wanted to look up what the difference between Raviolo and Girasolo is.
DuckDuckGo's (non-ai variant) top three results are all AI generated content with AI generated author images, bio, and "flair".
I want stuff written by *humans*, not this AI slop BS.
Created 3 waste_baskets; Updated a waste_basket
Updated 6 crossings
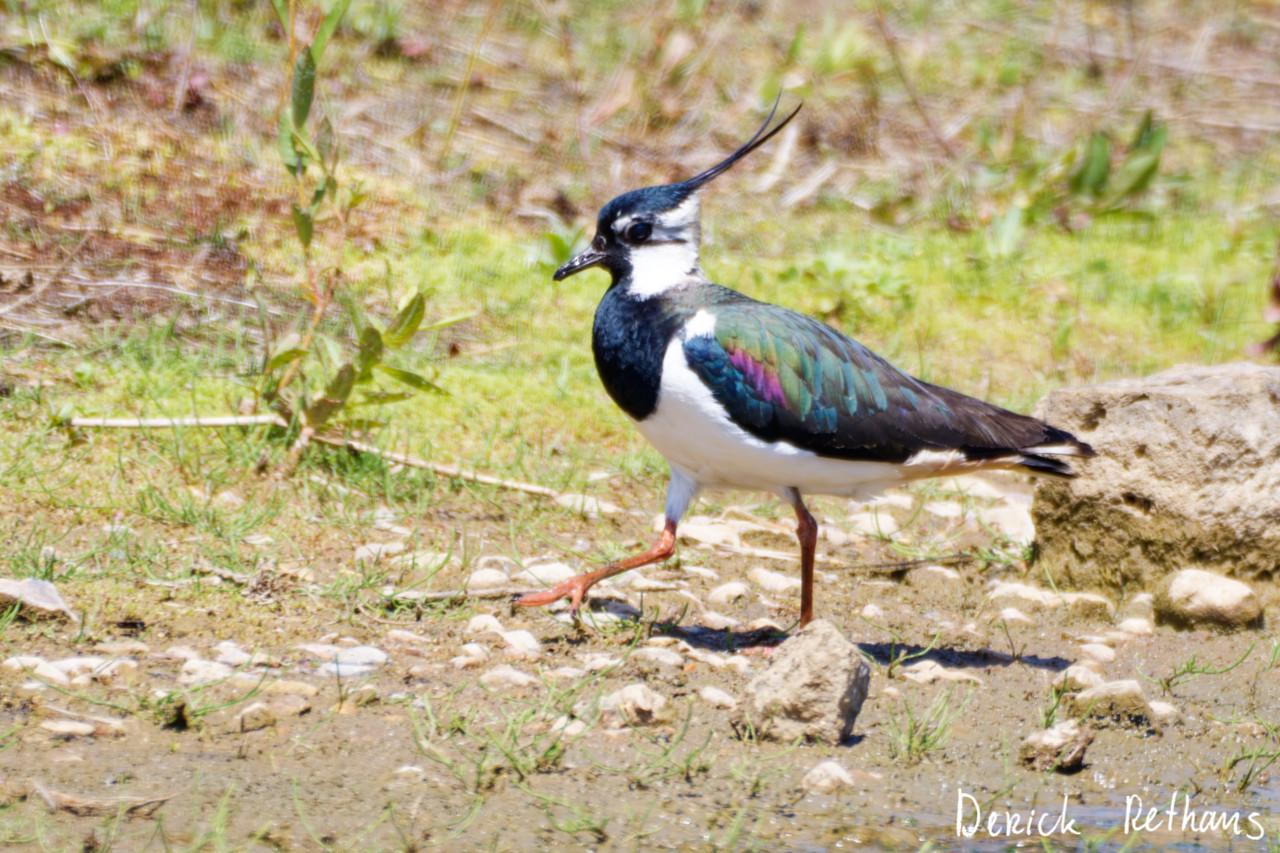
Northern Lapwing On The Move
This dapper bird is having a stroll looking for lunch. I like the iridescence in its wings.
#BirdPhotography #BirdsOfFediverse #Nature #Photography #London #BirdsOfMastodon
Created a vending_machine
Updated a bus_stop
I hiked 5.4km in 2h35m46s
I walked 2.2km in 27m13s
I walked 1.6km in 32m29s
I walked 3.3km in 34m33s
Updated a confectionery shop, a massage shop, and 2 other objects; Deleted a books shop
I hiked 7.0km in 4h21m00s
Updated a deli shop and a pet_grooming shop
I walked 4.2km in 49m42s
I walked 1.4km in 10m14s
I walked 2.2km in 1h43m13s
I walked 4.4km in 1h25m00s
Updated a cafe
Updated a bar
I walked 1.7km in 19m07s
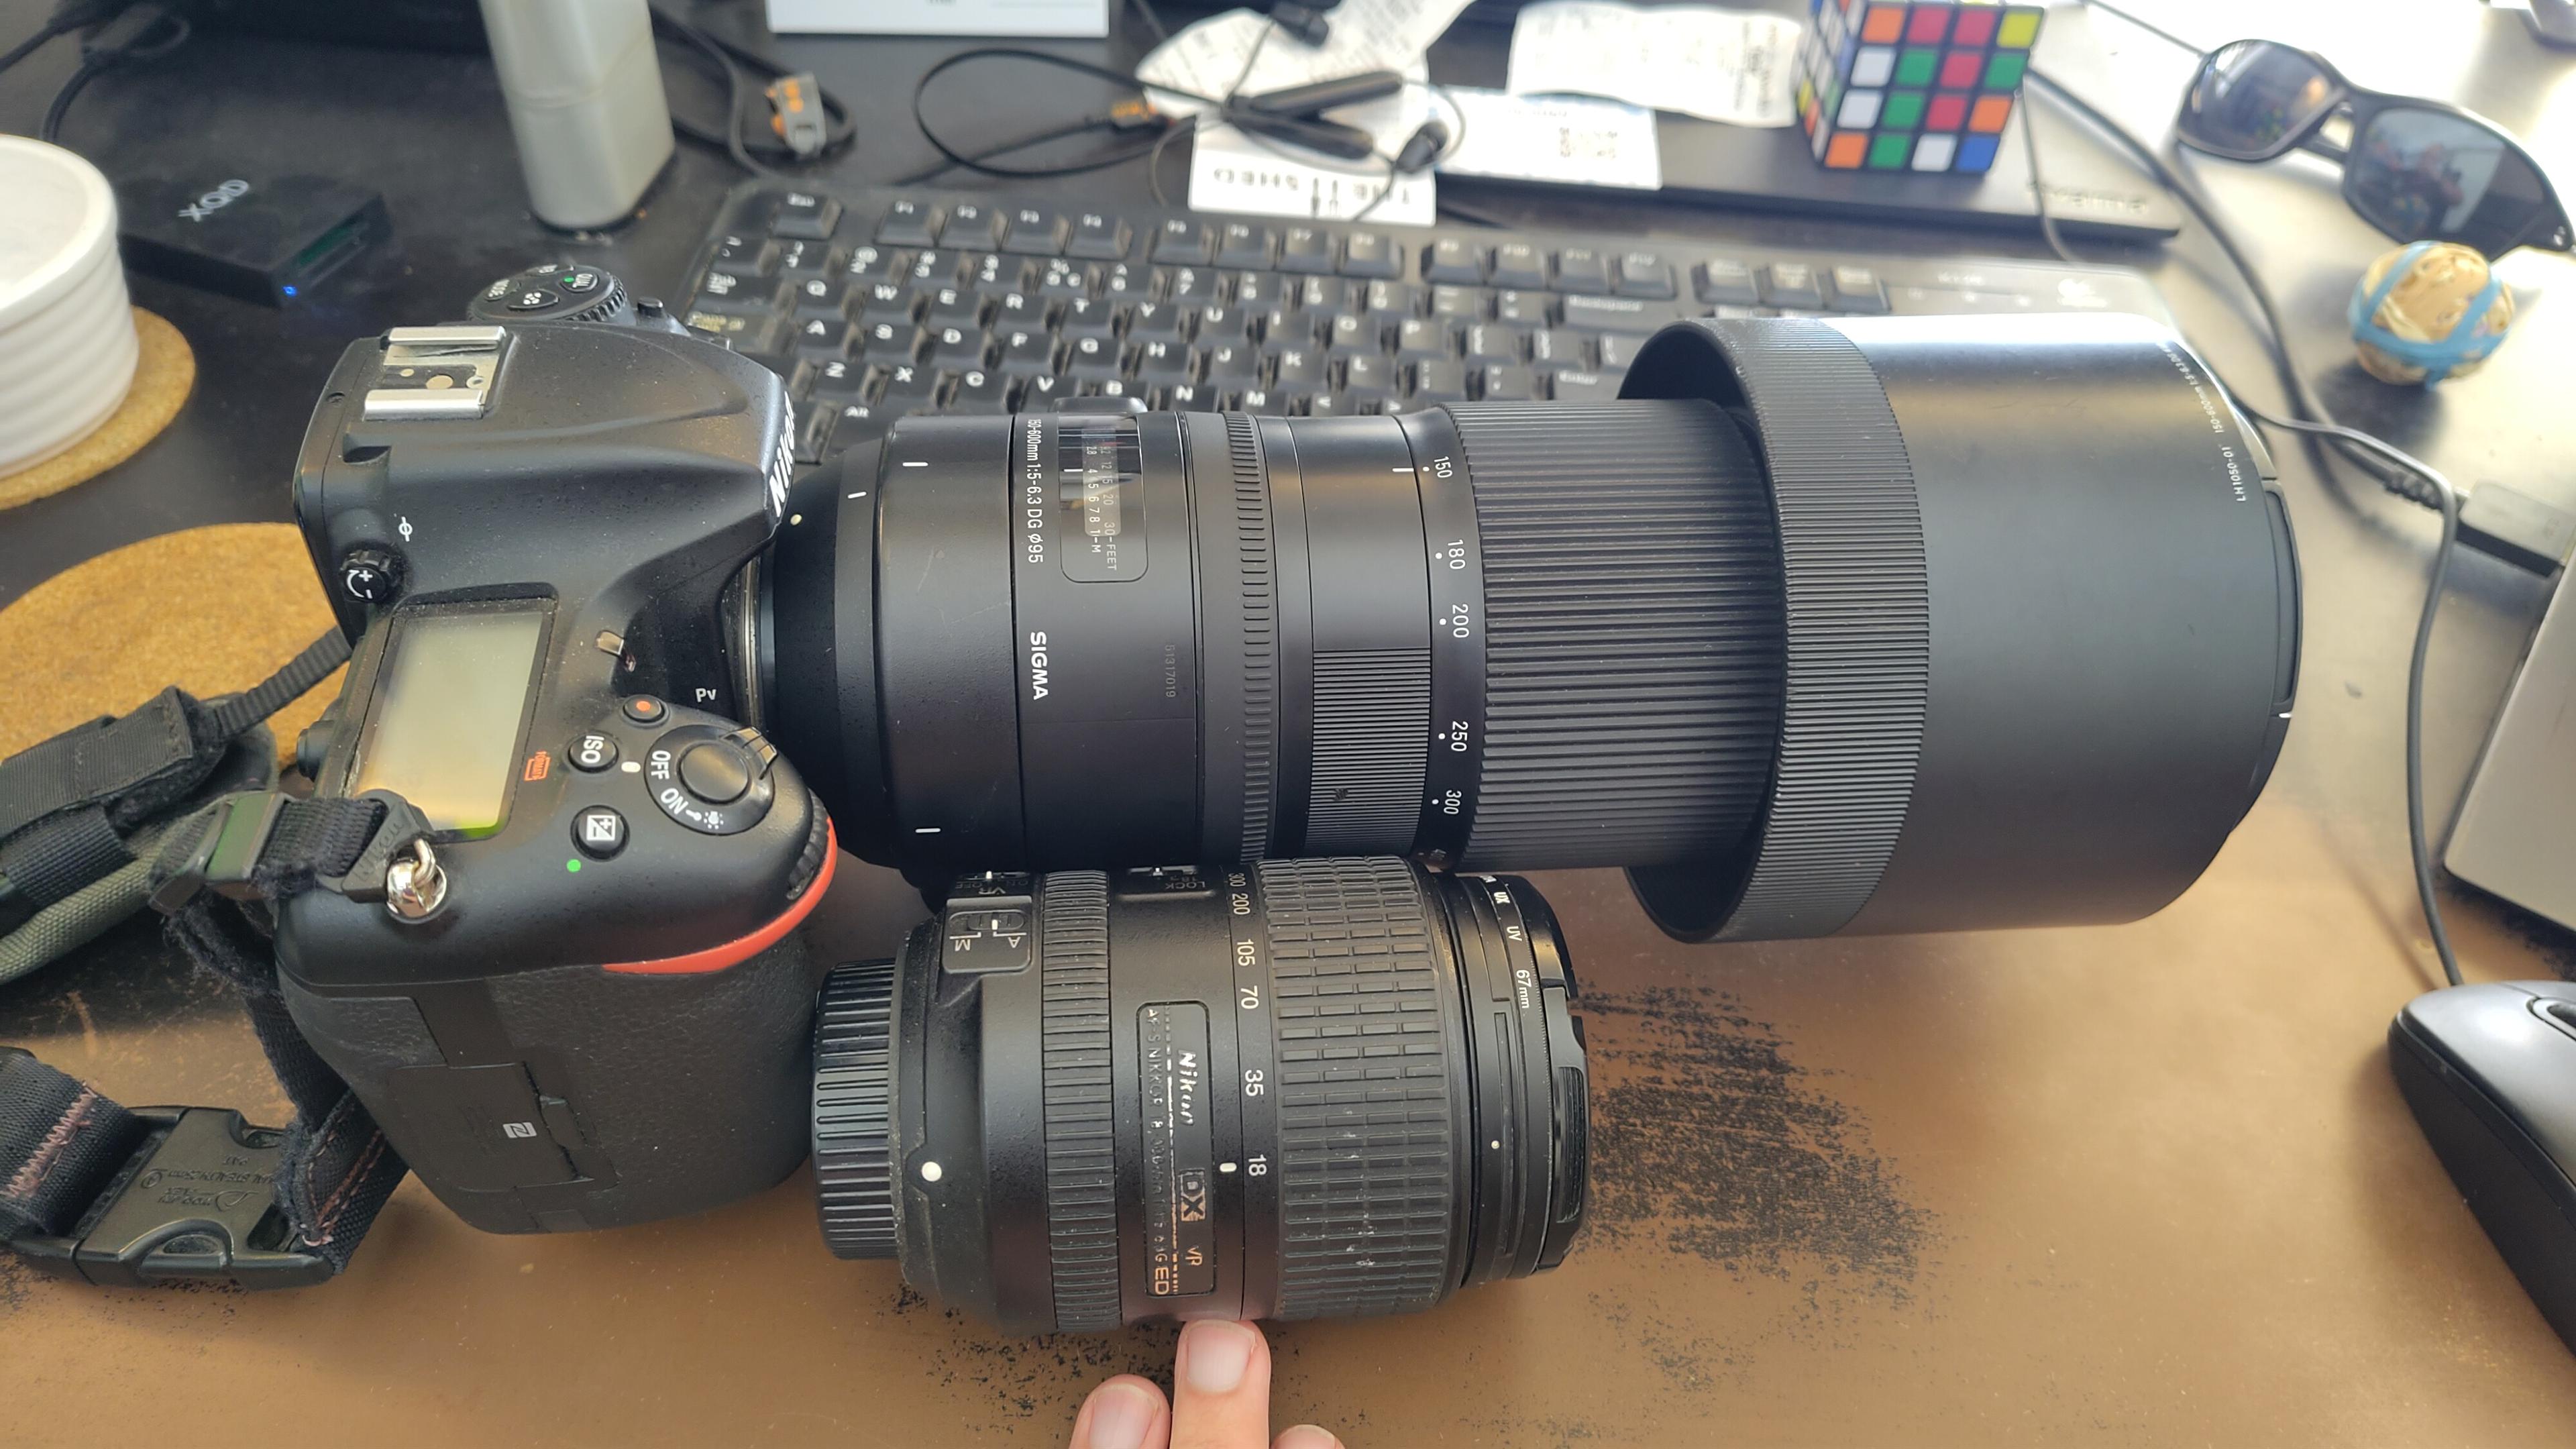
I got a new lens. It's a little bit larger, and loads heavier, than my older one.
#photography #naturephotography
I walked 1.6km in 15m10s
Shortlink
This article has a short URL available: https://drck.me/osmyoe12-a1g